Tables
Graphs
Writing Functions to Model Situations
Interpreting Models and Graphs
SAT Questions
100
Does the table model exponential growth or decay? Write the equation to model the data.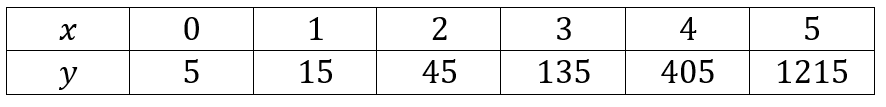
Exponential Growth: y=5(3)x
100
The graph shows the population of a pack of wolves that has been growing exponentially. Write an equation to model the number of wolves over time in years.
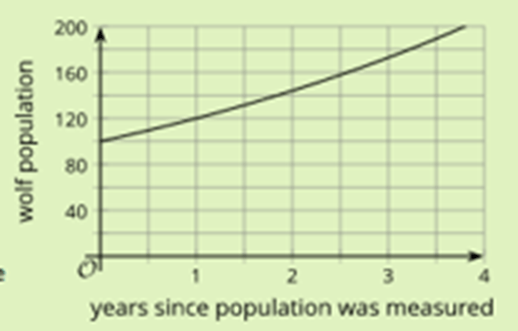
y=100(1.2)x
100
Jada received a gift of $180. The first week she spent a third of it. She continued to spend a third of what is left each week thereafter. Which equation best represents the amount of money she has over time in weeks?
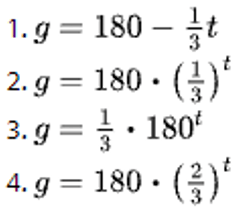
4. g=180(2/3)t
100
Here are two graphs of functions f and g. Function f is defined as f(x)=100(2)x. Which of the following could be an equation for g?
A. y=25(3)x B. y=50(1.5)x
C. y=100(3)x D. y=200(1.5)x
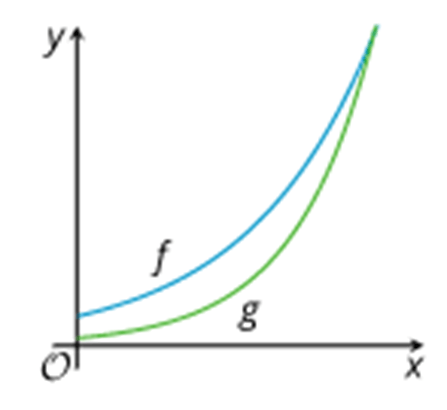
A. Needs to have a smaller y-int than 100 and a larger growth factor b, as it eventually surpasses function f.
100
The value of a stock is doubling every hour. Which of the following best describes the relationship between time (in hours) and the value of the stock?
A) Increasing linear
B) Decreasing linear
C) Exponential growth
D) Exponential decay
C
200
Does the table model exponential growth or decay? Write the equation to model the data.
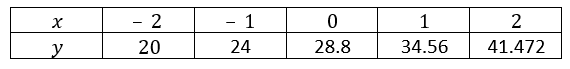
Exponential Growth: y=28.8(1.2)x
200
The cost, in dollars, to produce 1 watt of solar energy is a function of the number of years since 1977. Here is the graph of the function. Write an equation to model the cost to produce 1 watt of solar energy over time in years since 1977.
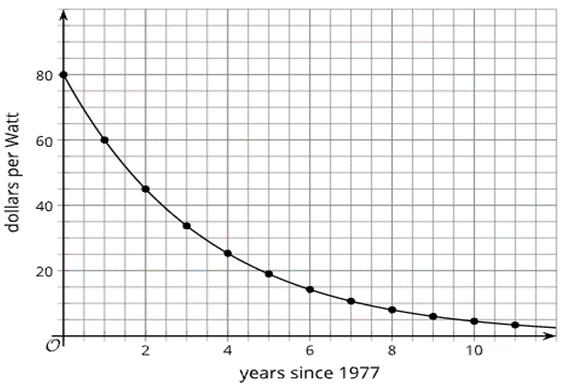
y=80(0.75)x
200
In a new neighborhood the number of trick or treaters has been increasing by a factor of 3/2 each year. The first year there were only 10 trick or treaters.
a. Write an equation to model the number of trick or treaters over time in years
b. How many trick or treaters will there be in 5 years?
c. How long until there will be 200 trick or treaters?
a. y=10(3/2)x
b. about 76 trick or treaters (just under)
c. In about 7 - 8 years
200
The equation p=5000(3)x represents the population of an invasive fish species in a large lake, x years since 2005, when the fish population in the lake was surveyed.
a. What was the population in 2005?
b. What does the 3 represent in this situation?
c. For this model, what does p(-2) mean? Find that value.
a. 5000 fish
b. b=3, the amount of fish is tripling every year
c. p(-2) represents the number of fish 2 years before the lake was surveyed. There would have been 5000(3)-2 which would be about 555 fish if the pattern continued before 2005.
200

D
300
Does the table model exponential growth or decay? Write the equation to model the data.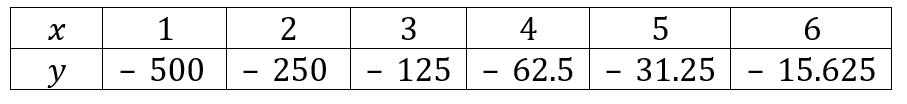
Exponential Decay: y=-1000(1/2)x
300
1. What is the y-intercept and what does it represent?
2.What is the fraction of acetaminophen that remains in your body each hour?
3. Write an equation to represent the amount of acetaminophen in your body after t hours. 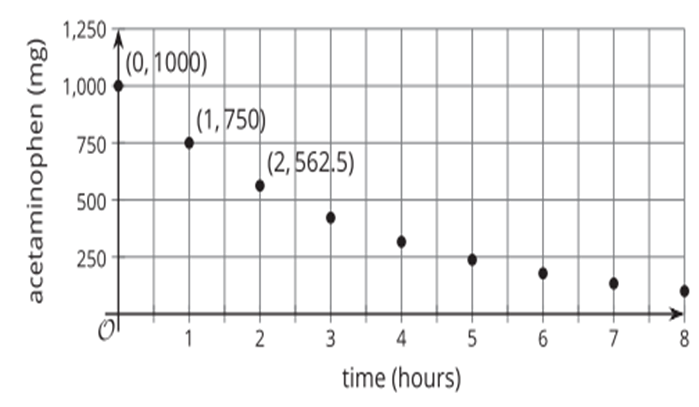
1. (0,1000), you took 1000mg of acetaminophen
2. 3/4 of the acetaminophen remains in your body each hour (1/4 is lost). 3/4 would be the b-value/factor in the equation.
3.
a=1000(3/4)^t
300
Suppose that a phone that originally sold for $300 loses 3/5 of its value each year after it is released.
a. Write an equation for its value of the phone t years after it is released.
b. After 2 years, how much is the phone worth?
c. When will it be worth only $5?
a. p=300(2/5)x
b. p=300(2/5)2=$48
c. In 4 - 5 years
300
1. Which algae bloom covered a larger area when the chemicals were applied? How do you know?
2. Which algae population is decreasing more rapidly. How do you know?
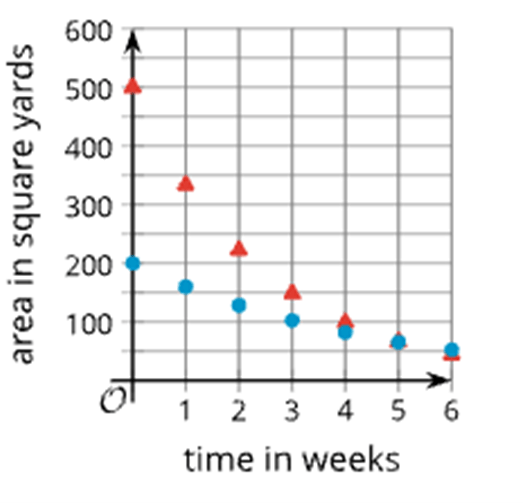
1. Red,triangular points - has a larger y-int. Begins at 500 sq. yards vs. 200 sq. yards of algae.
2. Red triangular points - has a larger initial decrease. I could estimate the factors as well, red b = 0.67 and blue b = 0.8. 0.67<0.8 means less remains each week so the red loses more each week making it decrease more rapidly.
red b = (150/500)1/3=0.67 or 330/500=0.66
blue b = (100/200)1/3=0.8 or 160/200=0.8
300

D