Solving Functions
Key Features
Domain & Range
Average Rate of Change
Spiral Review
100
Use the graph to determine f(6).
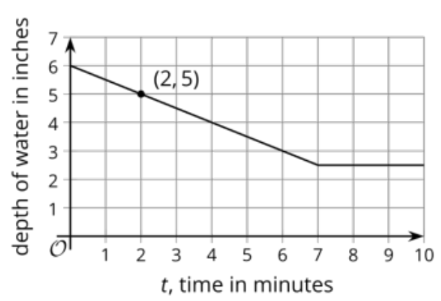
f(6) = 3
100
What is the highest point of a function?
the maximum
100
What is the set of all possible output values of a function?
the range
100
What is the average rate of change?
The slope
100
y = -4x + 7 written in standard form
4x + y = 7
200
The function f(x) = 6(x-2) - 12, what is f(10)?
f(10) = 36
200
What is the lowest point of a function?
the minimum
200
What is the set of all possible input values of a function?
the domain
200
What is the average rate of change between the following: (-2, 4) and (3, 12)
8/5 or 1.6
200
A correlation coefficient of -0.8 indicates a _________
correlation and a __________ slope for the line of best fit.
strong; negative
300
Use g(x) = x2 - 1 to find g(-3).
g(-3) = 8
300
What does the function f(0) represent?
the y-intercept (or vertical intercept)
300
What is the domain of this graph? Is the graph a function?
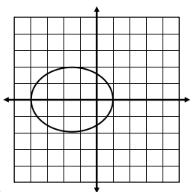
-4 <= x <= 1
300
What is the average rate of change between the following:
Mark was 60 inches tall in 2018
Mark was 67 inches tall in 2022?
(input: year, output: height)
+ 1.75 inches per year
300
Which graph correctly represents the solution to the inequality
4x-2y>=-4
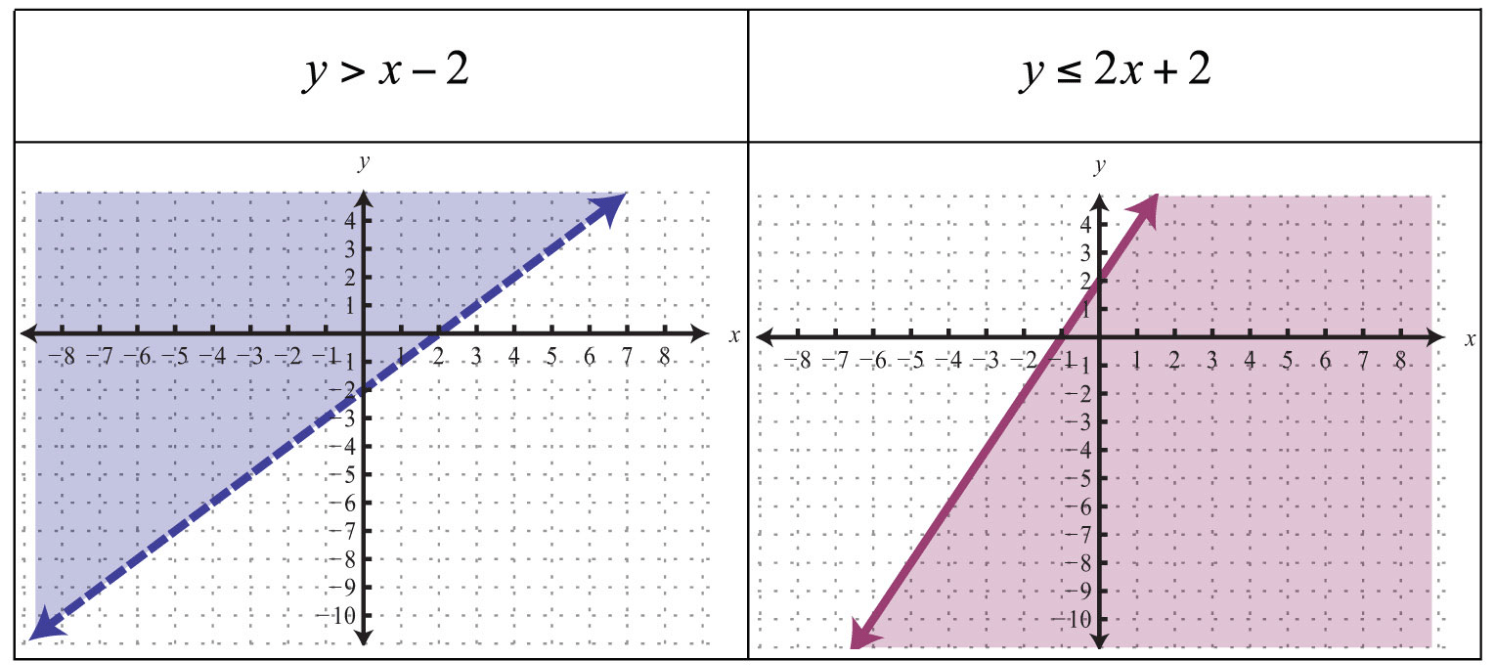
y<=2x+2
400
Given f(x) = -5x + 1, solve for x when f(x) = -4
x = 1
400
The weight of a chihuahua puppy (in lbs) is a function of its age (in months). What does f(12) = 8 mean in context?
A chihuahau puppy at 12 months weighs 8 lbs.
or A chihuahau puppy weighs 8 lbs at 12 months.
400
What is the range of this graph? Is it a function?
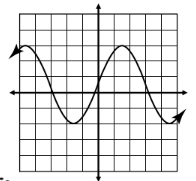
-2<=y<=3
400
Use the graph. What is the rate of change from x = 0 to x = 1?
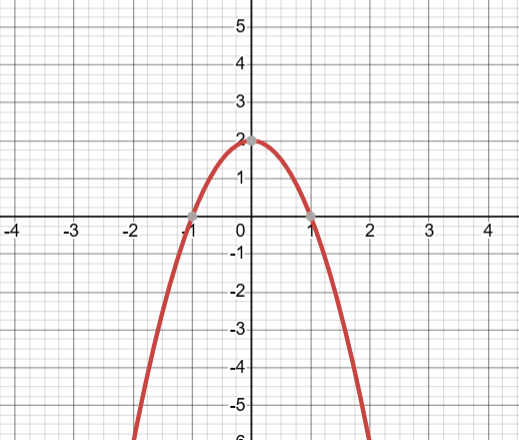
rate of change is -2
400
Solve for x.
2(x - 2) + 3x - 1 = -15
x = -2
500
Given h(x) = -x + 5, solve for x when h(x) = 3
x = 2
500
Use the graph. At what interval of x is the function increasing?
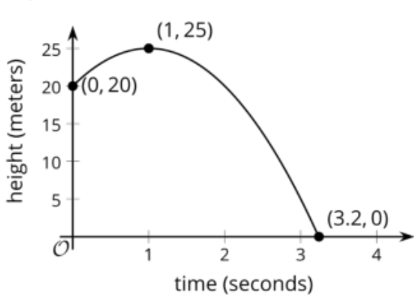
0<=x<=1
500
What is the domain and range of the graph?
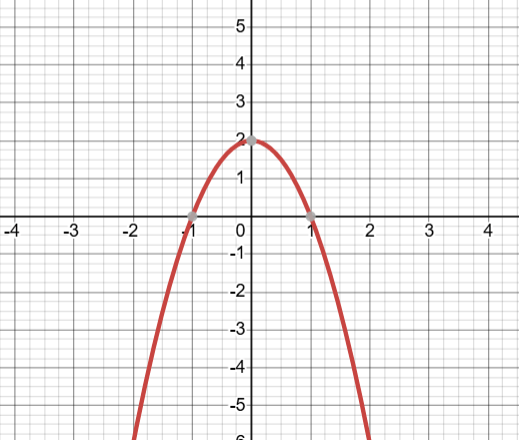
Domain and Range:
{x|x in R}
{y| y<=2
500
The function y = f(x) is graphed. What is the average rate of change of the function f(x) on the interval
-6<=x<=4 ?
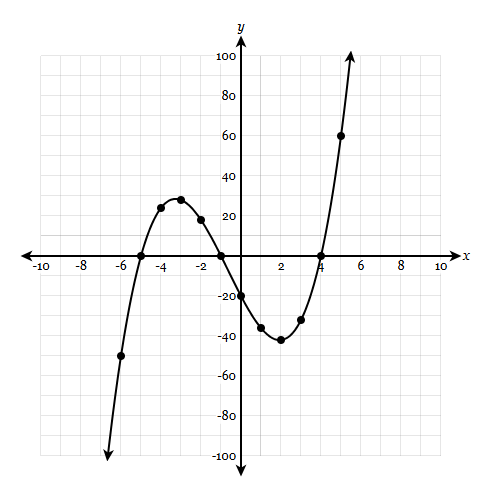
The rate of change is 5.
500
Solve the following equation for s.
1/2s + q = f
s = 2f - 2q or s = 2(f - q)