Mean, Median, Mode
Range, Quartiles, IQR
Box and Whisker
Dot Plots
Reading Histograms
100
Which measure of center requires the numbers be in order from least to greatest to calculate?
median
100
Give the max and min of the data set below:
25, 30, 32, 25, 27, 42, 25, 30
min: 25
max: 42
100
True or False: it is possible to find the mean of a data set using a box and whisker plot.
False
100
True or False: it is possible to find the median of a data set using a dot plot.
True
100
How many lottery winners were between 50-59 years old?

8
200
Which measure of center is most affected by having the number 0 in your data?
mean
200
Give the range of the data set below:
25, 30, 32, 25, 27, 42, 25, 30
17
200
What are the 5 points of data used to create a box and whisker plot?
Median, upper quartile, lower quartile, maximum, and minimum.
200
The dot plot below represents the ages of people visiting the local zoo. How many people age 40 and below visted?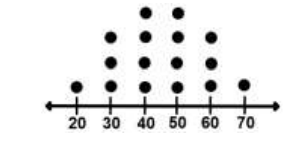
8 people
200
How many lottery winners were at least 60 years old?
9
300
Give the mean, median, and mode of the data set below:
3, 7, 5, 8, 3
mean: 5.2
median: 5
mode: 3
300
What are the upper and lower quartiles of the data set:
25, 30, 32, 25, 27, 42, 25, 30
LQ: 25
UQ: 31
300
Based on the box and whisker plot below identify the range of the data set:
12
300
Based on the dot plot below what is the mean of the data set?

Two
300
The histogram below represents peoples test scores. How many people took the test?

18
400
Give the mean, median, and mode of the data set:
20, 30, 20, 15, 6
mean: 18.2
median: 20
mode: 20
400
Give the IQR of the data set below:
102, 100, 108, 106
6
400
Based on the box and whisker plot below identify the IQR of the data set:
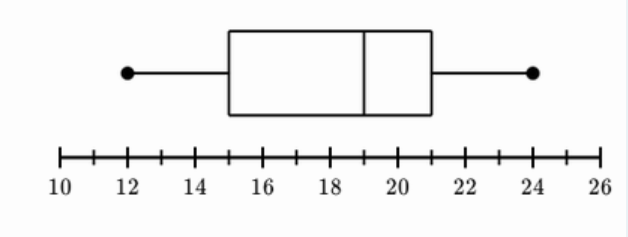
IQR = 6
400
Based on the dot plot below what is the median of the data set?

Two
400
How many lottery winners were 39 years old or younger?
7
500
Give the mean, median, and mode of the data set below:
3, 6, 9, 7, 4, 6, 7, 0, 7
mean: 5.4
median: 6
mode: 7
500
Based on the data set is the range or IQR greater?
11, 12, 17, 12, 18, 15, 14
Range
500
Which box and whisker plot below has data closest to the median of the data?
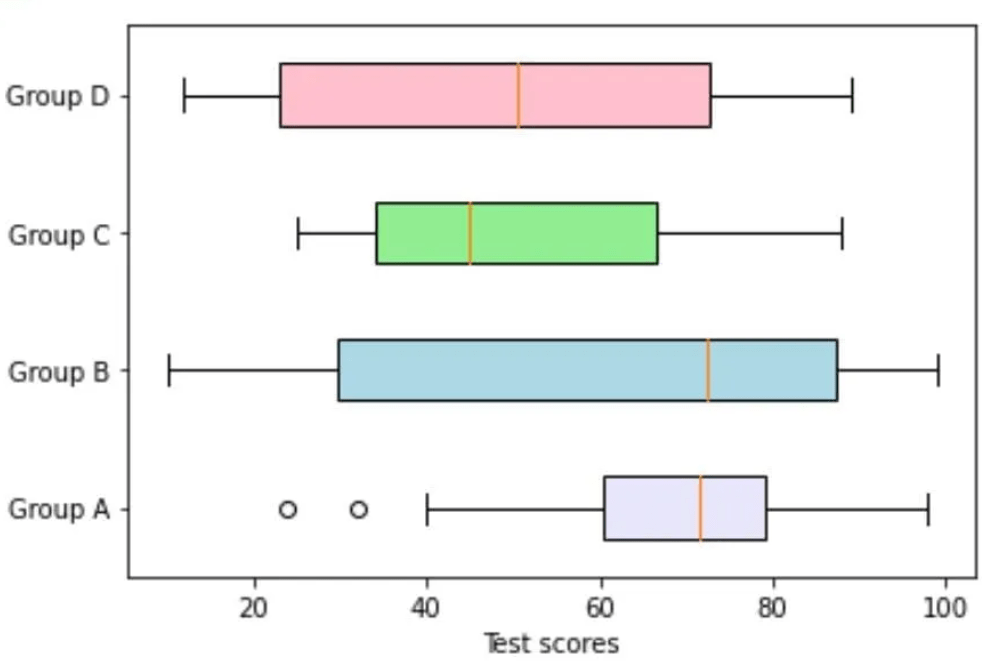
Group A
500
Based on the dot plot below order the amounts below from least to greatest:

A)Lower Quartile
B)Median
C) Range
D)IQR
D, A, B, C
500
What is the most common age group?
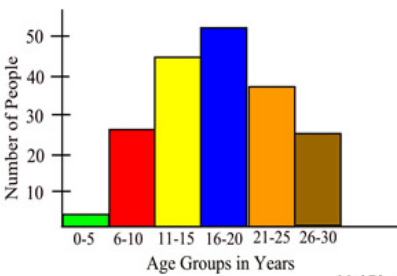
16-20 years