scatterplots
more scatter plots
Vocab
patterns
coordinate graphs
pattern/rule
ordered pairs
100
How many mistakes did the student who practiced 7 hours make?
2
100
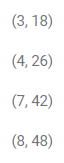
How many umbrellas were sold during the month 1 inch of rain fell?

5 umbrellas
100
What is the name of the axis the arrow is pointing to?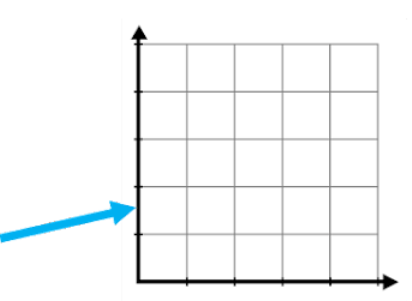
y-axis
100
7
100
When David was 3, how old was John?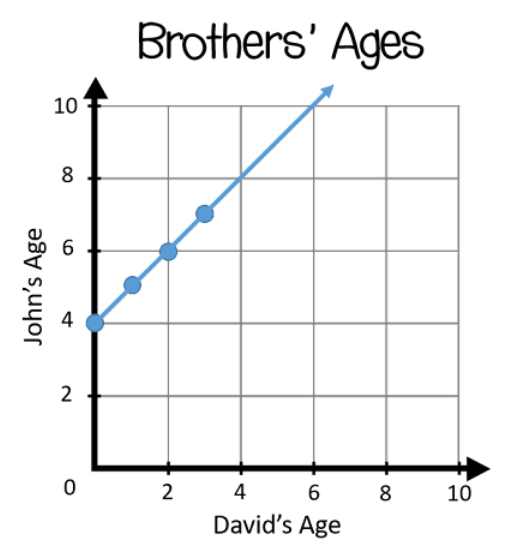
7
100
48
100
Which point is located at the origin?
A
200
How long did the person who made 1 mistake practice?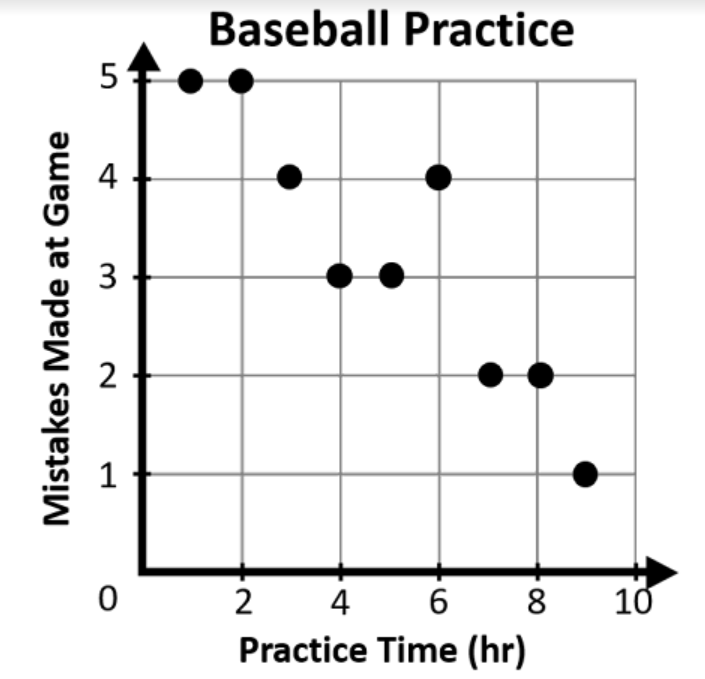
5
200
What was the temperature on the day 40 snow cones were sold?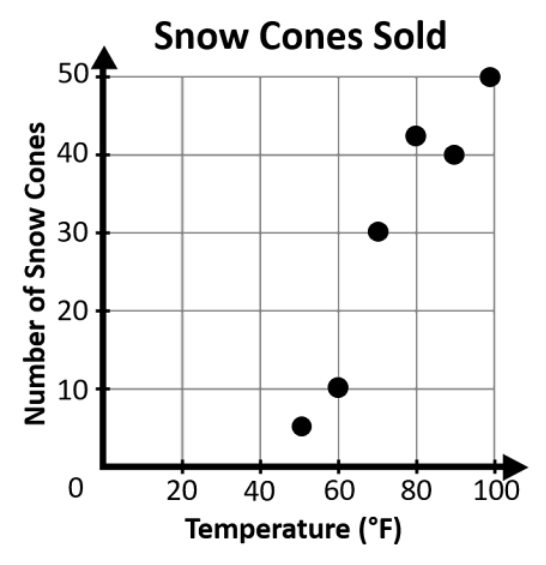
90 degrees
200
What is the name of the axis the arrow is pointing to?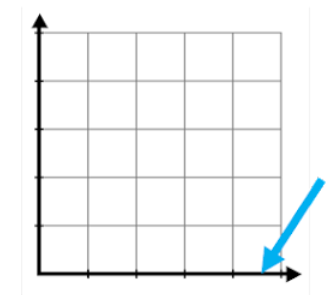
x-axis
200
Is this pattern additive or multiplicative?*
Additive
*equation?
200
When David is 6, how old will John be?
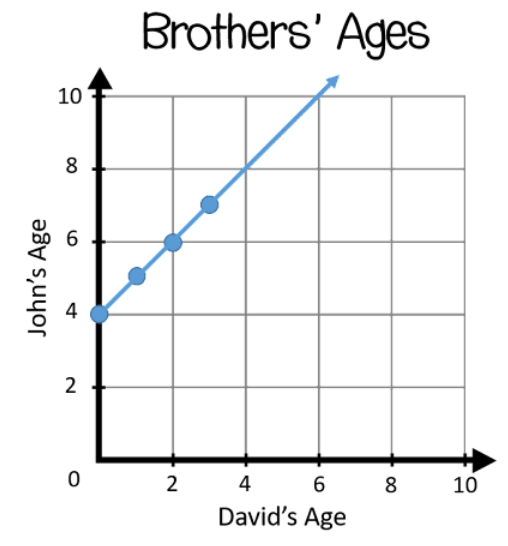
10
200
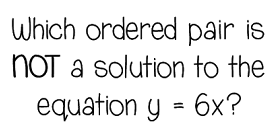
(4,26)
200
What is the name of the point located at (4,3)?
C
300
What was the temperature on the day 40 snow cones were sold?
90 degrees
300
How much rain fell during the month 35 umbrellas were sold?
3 inches
300
What is the best name of this location?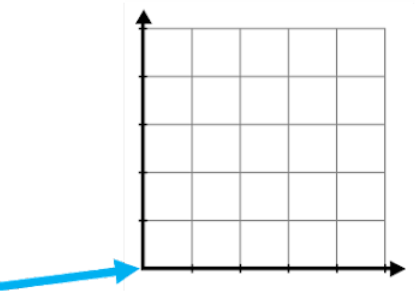
origin
300
Is this pattern additive or multiplicative? *
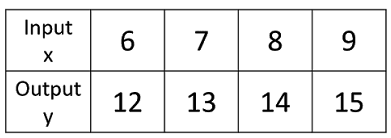
Additive
*equation?
300
How many months did it take to save $25?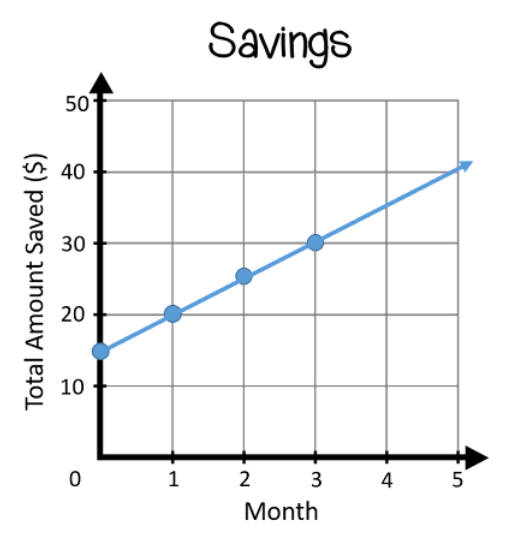
2 months
300
Which equation best represents the relationship between Anna’s and Derek’s age?
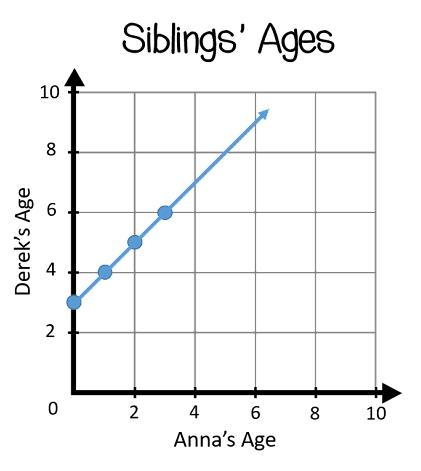
x + 3 = y
300
What is the location of point F?
(5,1)
400
How many more snow cones were sold when it was 90 degrees than when it was 60 degrees?
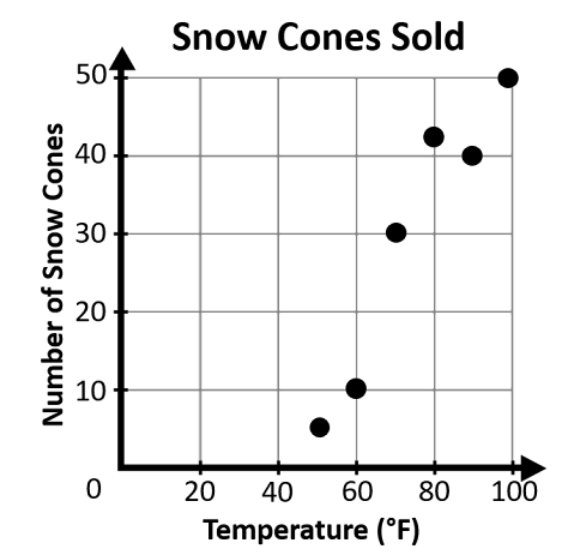
30 snow cones
400
How many more umbrellas were sold during the month it rained 4 inches than the month it rained 2 inches?

30
400
What is this called?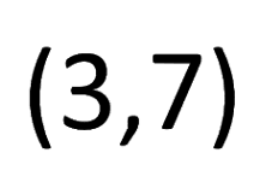
an ordered pair
400
Is this pattern additive or multiplicative?*
Multiplicative
*equation?
400
What does the ordered pair (2,6) represent?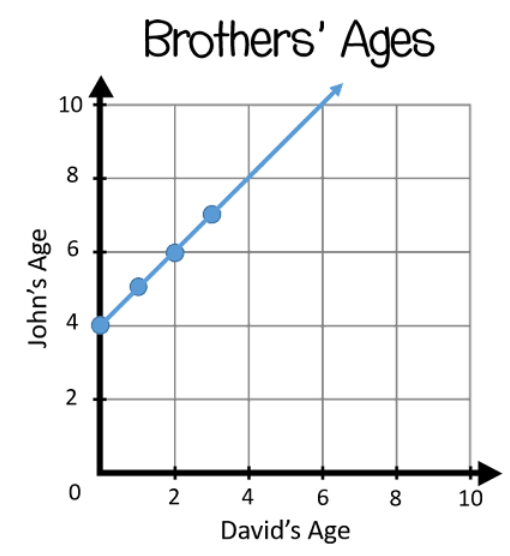
When David was 2 years old, John was 6
400
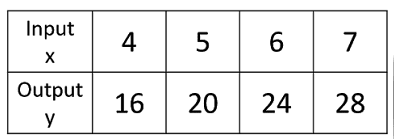
Which equation best represents the graph?
y = 4x
400
What is the location of point S?
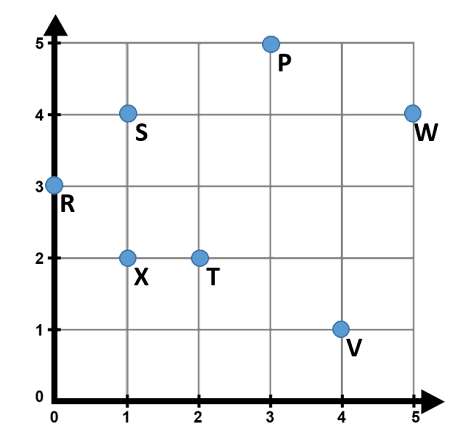
(1,4)
500
The scatter plot shows the relationship between the amount of practice and the number of mistakes made in the game. Is there a trend shown on the scatter plot? If so, what does the trend suggest?
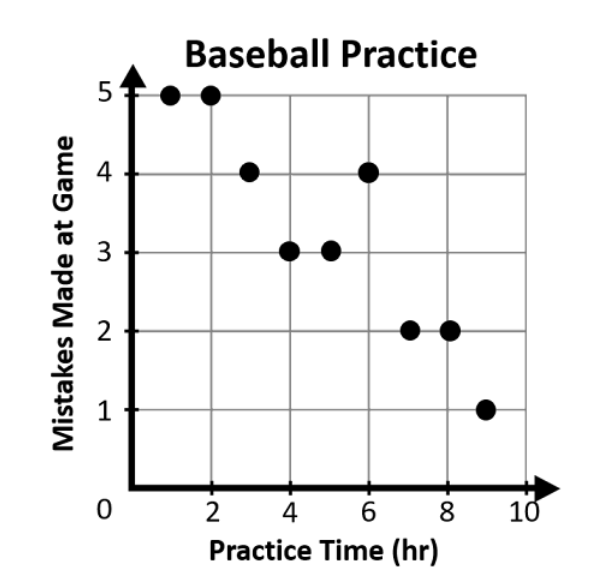
Yes; the more a player practiced, the less mistakes he made in the game.
decreasing
500
The scatter plot shows the relationship between the amount of rain each month and the number of umbrellas sold. Is there a trend shown on the scatter plot? If so, what does the trend suggest?

Yes: the more it rained, the more umbrellas were sold.
Increasing
500
Which best describes how to find this location?

start at the origin, then go right 3 and up 7
500
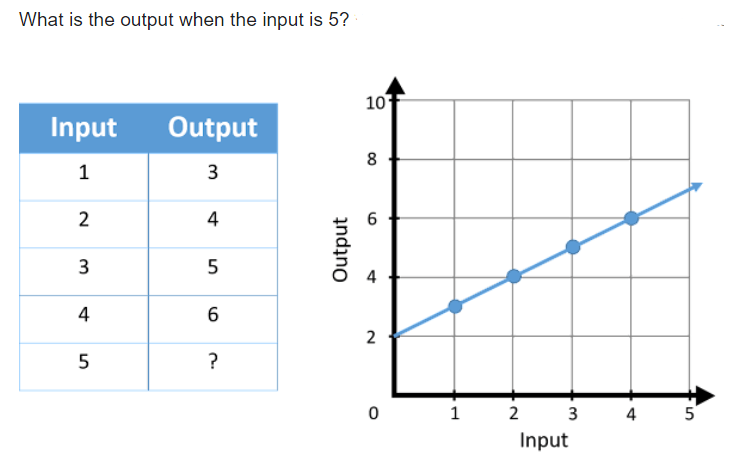
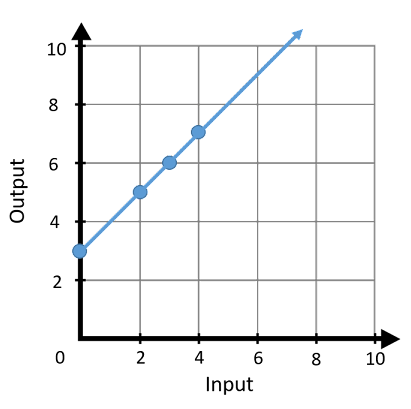
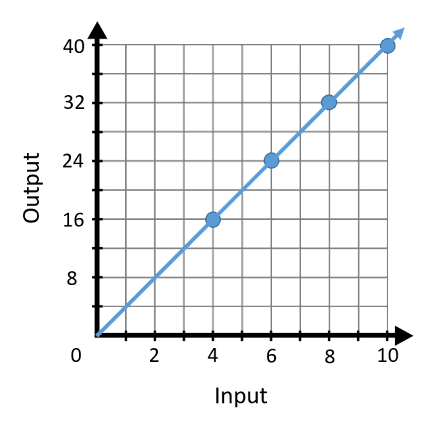
Which equation matches the data in the graph?
y = 4x
500
How many pages were read each day?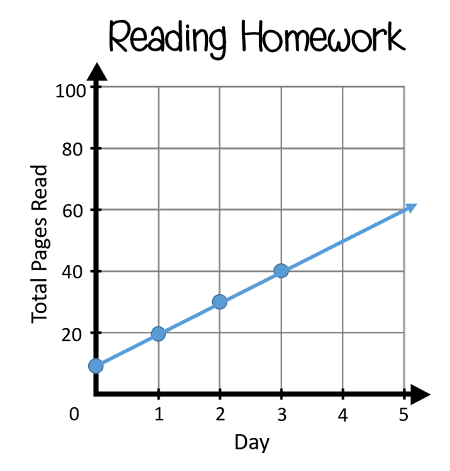
10
500
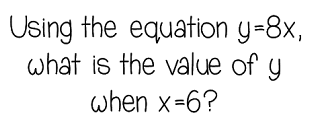
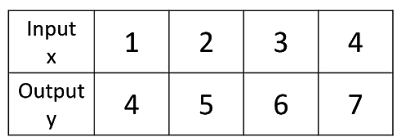
What is y when x = 3?
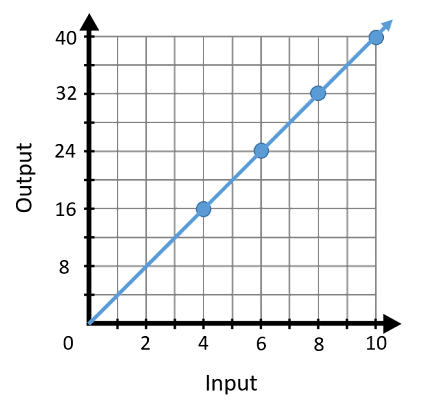
12
500
What is the location of point R?

(0,3)