What the Function?
Show Some Definition
Scatterbrained
No Two Ways About it
First Rate Student
100
The graph of a function will never have this.
What is a vertical line?
100
A relationship in which every input has exactly one output.
What is a function?
100
As x increases, y does this.
What is decrease?
100
The number of 6th graders who play bass.
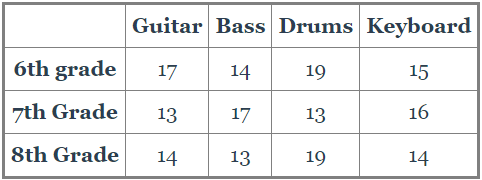
What is 14?
100
The rate of change in y=2x-5.
What is 2?
200
The graph below represents this.
What is a function?
200
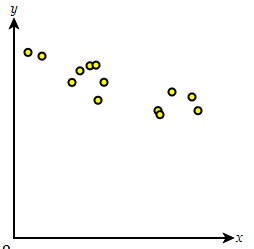
A graph that shows a set of random data points that cannot be described by an equation.
What is a scatter plot?
200
The meaning of the point on the line of best fit where y=75.
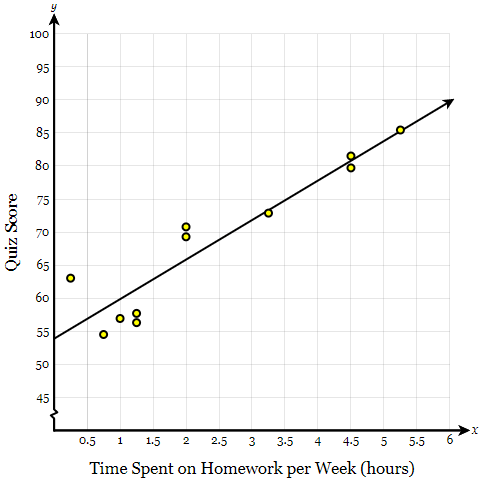
What is the expected score for a student spends 3.5 hours on homework per week?
200
The percent of students who spend less than 4 hours on screens per day with a grade average of more than 80%
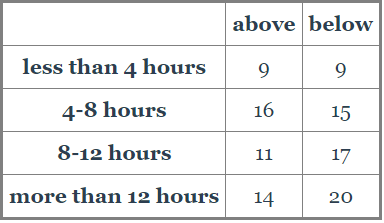
What is 50%?
200
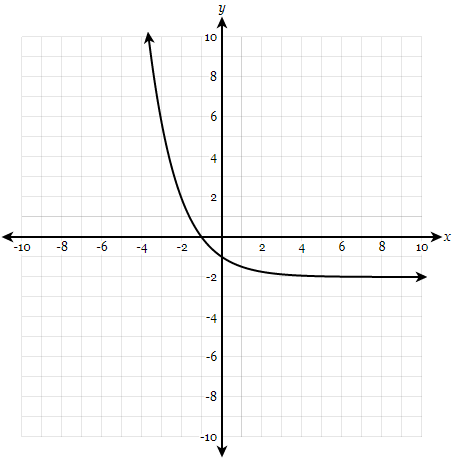
The rate of change for the function below.
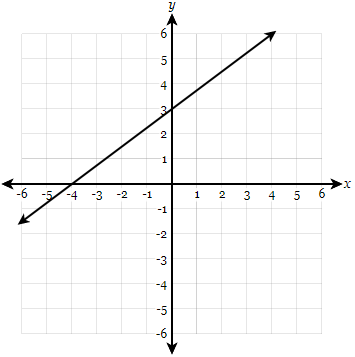
What is 3/4?
300
The graph below represents this relationship.
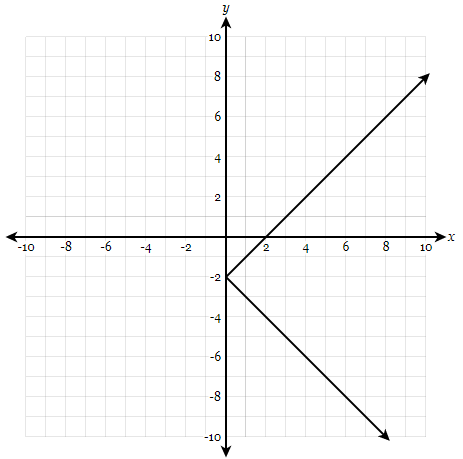
What is a non-function?
300
A collection of data based on two different variables.
What is bivariate data?
300
The trend shown in the plot below.
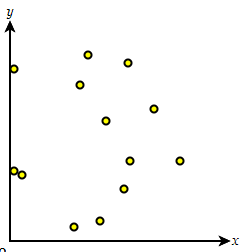
What is no correlation?
300
The number of adults who prefer print readings using the data given.
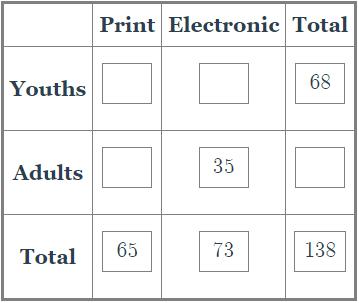
What is 35?
300
The rate of change for the following function.
What is -3/2?
400
The relationship shown by the table below.
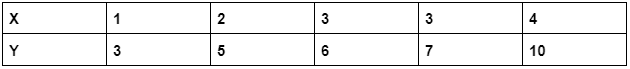
What is a non-function?
400
The frequency of a set of data points relative to the total.
What is relative frequency?
400
Based on the line of best fit, the number of chirps per minute you would expect at 78 degrees.
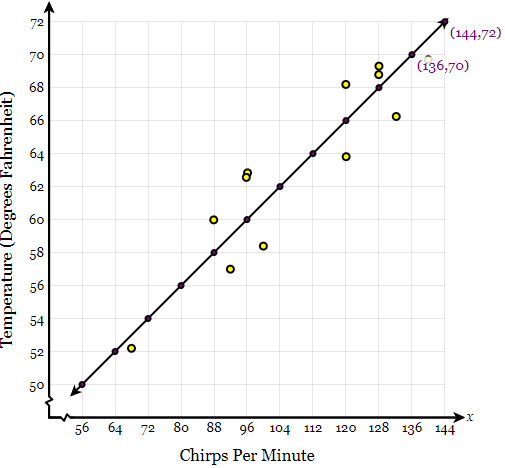
What is 160?
400
The percent of store-goers who are women.
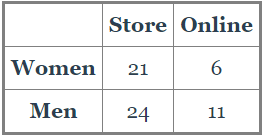
What is 46.67%?
400
The rate of change for the following function.
What is 4?
500
The set of coordinates that does not represent a function.
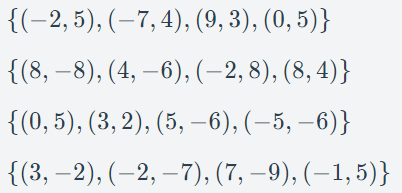
What is set 2?
500
A table used to represent bivariate data.
What is a two-way table?
500
Based on the line of best fit, the temperature you would expect it to be at 96 chirps per minute.
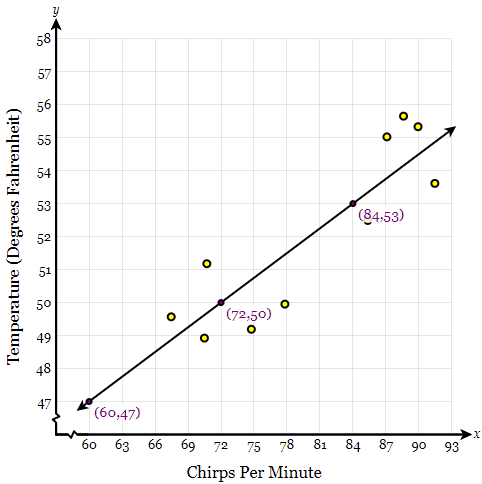
What is 56 degrees?
500
The percent of under 21 people who do not like any of the sports listed.
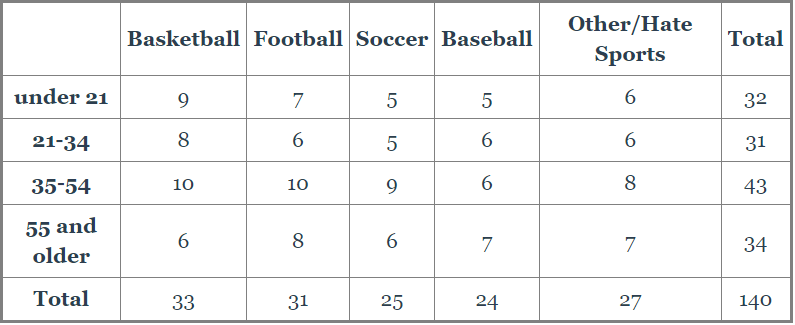
What is 18.75%?
500
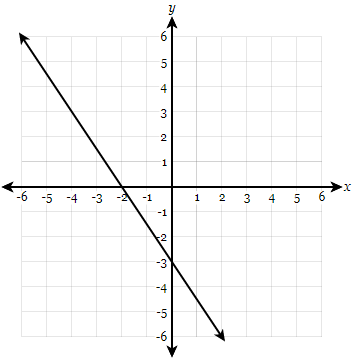
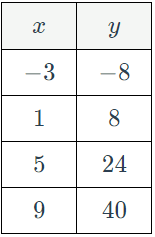
The equation for the following function:
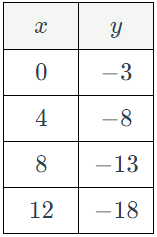
What is y=-5/4x-3?