Vocabulary
Association
Predictions
Analyzing
Two-Way Tables
100
What is the term used for a piece of data that does not fit with the rest of the data?
What is outlier
100
Determine the association shown in the scatter plot below.

What is positive linear
+100 Bonus Points: Strong
100
Make a prediction for the altitude of the balloon at 2 minutes.

What is 434 ft
Acceptable: 430-440
100
Write an equation for the trend line for the scatter plot below, given points (0,0) and (5, 20).

What is y=4x
100
Determine the number of females with 2-door model cars.

What is 44 females with 2-door cars
200
When creating a line of best fit you want to go through the ____________ of the data.
What is middle
200
Determine the association in the scatter plot below.

What is no association
200
Make a prediction for the test score of a student who studies 2.5 hours.

What is 78
Accepted: 76-80
200
Which trend line is the best model of the data?


What is trend line 1
200
Does the data below support the statement that there are more high school students who wear glasses than middle school student who were contacts?

Yes, there are 11 high school students with glasses and 6 middle school students with contacts
300
What is the term for a line on a scatter plot, drawn near the points that approximates the association between the data sets?
What is trend line
300
Determine the association of the scatter plot below.

What is nonlinear
300
Make a prediction for the volume of the tank at 12 minutes.

What is 230 gal?
Accepted 210-250
300
Write the equation for the trend line shown in the scatter plot below, using the two points (0,453) and (10,359).

What is y=-9.4x+453
300
Determine the total number of 3-point shots made by all students (upperclassman and underclassman)

What is 29 3-point shots
400
The term cluster means what?
What is a group of points that lie close together
400
Determine the full (type, strength, and ???) association of the scatter plot.
What is weak negative linear
400
Make a prediction for the amount of time passed, when the freezer temperature is 25°
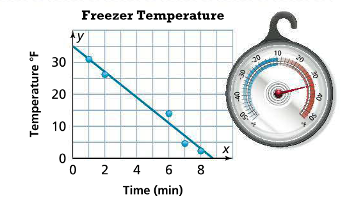
What is 2.5 minutes/ 2 minutes 30 seconds
Accepted: 2 minutes- 3 minutes
400
Describe a real world relationship that would have a strong positive association.
Possible answer: As number of hours studied increase, test scores would increase.
400
Does the data in the table below support the statement that the amount of 8th grade students that have 3-4 hours of homework is less than the amount of 6th grade students with 1-2 hours of homework?

No, there are 65 8th grade students with 3-4 hours of homework, and 53 6th grade students with 1-2 hours of homework.
500
What are the three types of association?
What is positive, negative and no association.
500
Determine the full association for the scatter plot below.

What is strong nonlinear
500
Given points on the graph, (0,453) and (10, 359), and trend line equation y=-9.4x+453 make a prediction for how long (in minutes) it will take for the balloon to reach the ground.

What is 48.2 minutes
Accepted 47-49 minutes
500
What would be the starting and ending points of the trend line for the following scatter plot.
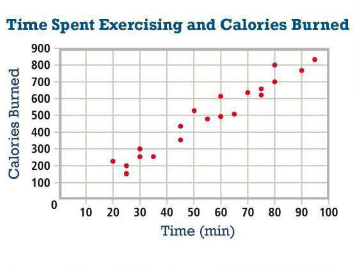
What is (8,0) to start and (95,900) to end
Accepted: Start x-value 5-10
End x-value 90-100
500
Determine the percentage of total students surveyed that are in 6th grade.
What is 28.86%
Accepted: 29%, 28.9%