Broken Line or Line graph
What is the difference between Qualitative and Quantitative Data
Quantitative is a number.
Qualitative is a sense or opinion, words
The following are the weights in Kilograms of Newman"s dogs:
3, 2, 26, 9
What is the mean weight in Kilograms
3+ 2 +26 +9 = 40
40/4 = 10
10
Peter is a salesman at a cell phone company. He earns 5% commission on all of his sales. If Peter’s sales this week totaled to $3,975, how much commission did he earn?
3975 X .05 = $198.75
Researchers performed a survey of the populations of several small islands. The data is represented by the following histogram.

What percentage of islands surveyed had a population of less than 140?
.3 + .35 = .65

Bar Graph
What is the difference between Discrete Data and Continuous Data
Discrete data are counts.
Continuous Data is a measurement.
Find the Median of the Data set:

1 1 3 4 4 5 6 6 6 7 9
Median is 5
Demi sells dance shoes at her boutique. She buys a pair of tap shoes from a distributor for $22, and she marks the price up by 30%. How much does Demi sell the tap shoes for?
22 X .30 = 6.6
22 + 6.60 = $28.60
Using the given double box plot, which club has a higher interquartile range?
A. Both are equal.
B. Club 2
C. Club 1
Club 2 - 60-20 = 40
Club 1 - 60-30 = 30
B. Club 2

Pie Graph or Circle Graph
What is the difference between Primary Data and Secondary Data
Primary Data is collected by you.
Secondary Data is from another source like the computer.
Find the Mode of the following Data
35 36 37 38 40 40 41 42 43 55 55 55 56 57 58 59
55 is the Mode
Dwade is thinking about buying a laptop that costs $559, but he would also have to pay 7% sales tax. How much would Dwade pay in tax?
559 X .07 = $39.13
Two cars A and B are racing. The distribution of their speeds at 5 second intervals are represented by the box plots.
Which car has a more symmetric distribution of speeds?
A. Car A
B. Neither of them
C. Car B
C. Car B

Histogram
What is the difference between a Random Sample and a Population
A piece of a population that represents the whole population is a Random Sample.
The larger group that a sample is taken from is a Population.
What is the Median of the Data represented:
Q2 = 85
Uri paid a landscaping company to mow his lawn. The company charged $74 for the service plus 5% tax. After tax, Uri also included a 10% tip with his payment. How much did he pay in all?
74 X .05 = 3.7
74 + 3.70 = 77.70
77.70 X .10 = 7.77
77.70 + 7.77 = $85.47
Calculate the MAD of the following Data:
29, 34,35,36,28,32,31,24,24,27,34
334 / 11 = 30.36 (30.4)
1.4 + 3.6 + 4.6 + 5.6 + 2.4 + 1.6 + .6 + 6.4 + 6.4 + 3.4 + 3.6 = 39.6
39.6 / 11 = 3.6
MAD = 3.6
Double Bar or Multi-Bar Graph
What is the difference between Stratified Random Samples and Systematic Random Samples
Stratified is dividing population into groups to Sample
Systematic is when you ask the nth person in a list.
Find the Mean Height.

82 + 82 + 83 + 83 + 83 + 84 + 84 + 84 + 84 + 84 + 85 + 85 + 85 + 85 + 86 = 1259
1259 / 15 = 83.93 (83.9)
Michelle went to the corner deli. She bought her sister a hot dog for $3.25, her brother a hamburger for $4.20 and a vegetable stir fry sub for herself for $5.50. She also bought 3 large sodas for $1.25 each but the sodas were 50% off. How much did she spend?
1.25 X 3 = 3.75
3.75 X .50 = 1.875 (1.88)
3.25 + 4.20 + 5.50 + 1.88 = $ 14.83
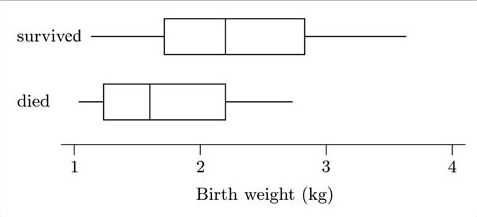
According to the data what statement can you make about birth weight and survival rate? Explain how the information backs your conclusion?
You can see immediately that the median birth weight of infants who died is less than the lower quartile of the birth weights of infants who survived (that is, over three-quarters of the survivors were heavier than the median birth weight of those who died). So it looks as if we can safely say that survival is related to birth weight.


