Vocab
Box/Dot Plots/Histograms
Word Problems
r - values/line of best fit
Miscellaneous
100
Which of the following is the same as the average?
mean
100
what is the distribution shape?
bimodal
100
What is the standard deviation of the data set? (round 2 decimal places)
$630, $617, $509, $590, $697, $603, $634, $587, $559, $634, $700, $680
56.21
100
What does correlation mean? Give an example.
As ice cream sales increase, the number of shark attacks increase, but one does not cause the other
100
What does the line of best fit do?
Cuts the data in half as best it can
200
The value that occurs the most often is what?
mode
200
What is the distribution shape?
bell shape
200
What percent of the data are greater than 18?
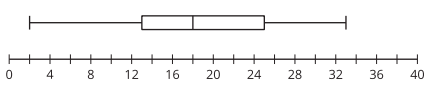
50%
200
Give an example of a causation
The more movie tickets you buy, the more money you will spend
200
What does a positive strong correlation mean?
the data is going in an upward pattern and the points are close to the line of best fit (close to 1)
300
Q3-Q1 is how you find the what?
IQR
300
What are the appropriate measures of center and spread to use with the data?
a) mean, IQR
b) mean, median
c) median, standard deviation
d) IQR, standard deviation
c
300
Here are the rates of two products from scale of 0 to 9 (9 being very good)
Product A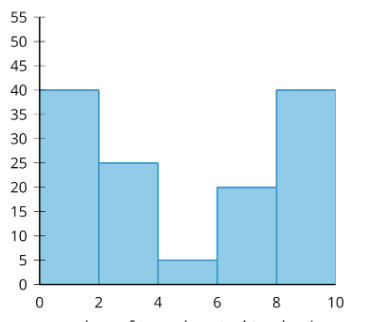
Product B
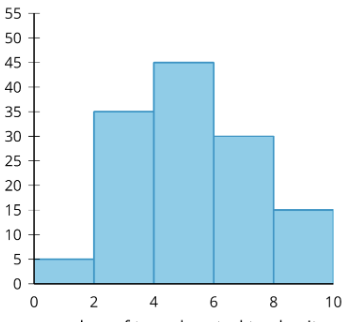
Select all that are true about the two histograms.
The standard deviation of product A is greater than the standard deviation of product B
The median rating of product B won’t change if product B receives an additional BAD rate
Both products have the same standard deviation.
The lowest rating for Product A received is 0
The highest rating for Product B received is 5.
1, 4
300
Match the r value to the correct scatter plot.
a) r = 0 b) r = 0.4 c)r = – 1 d) r = -0.65
1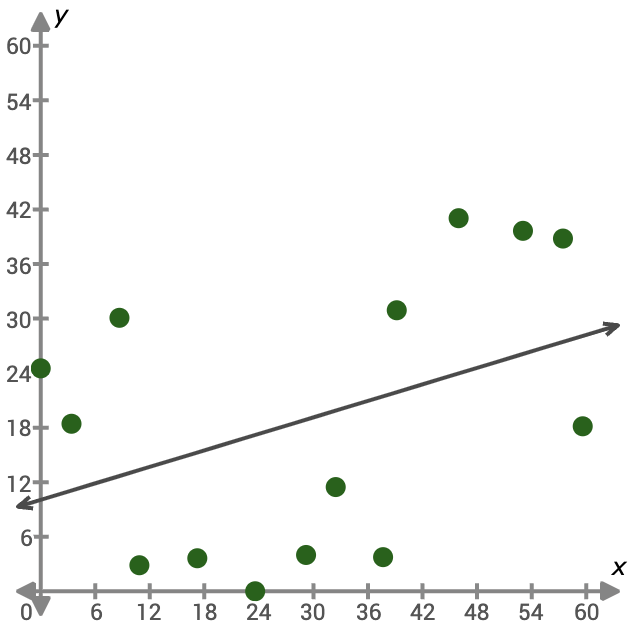
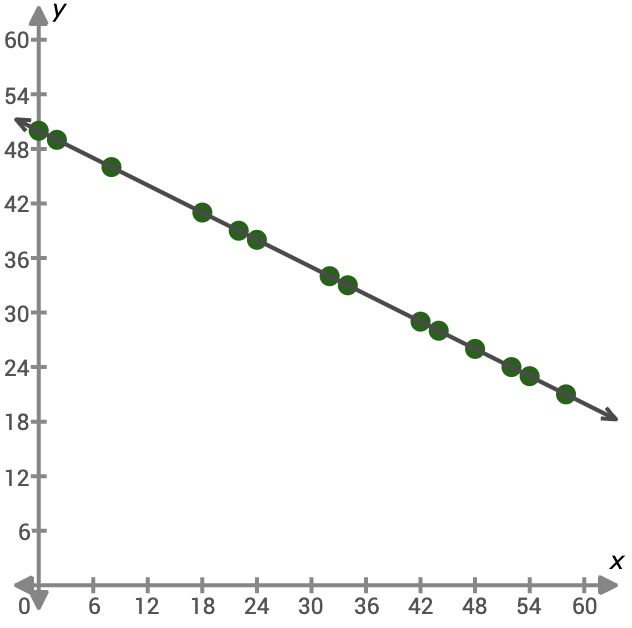
3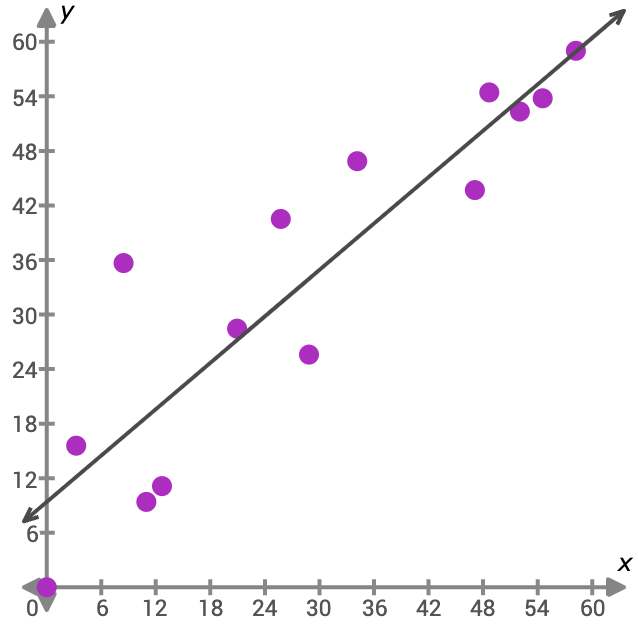
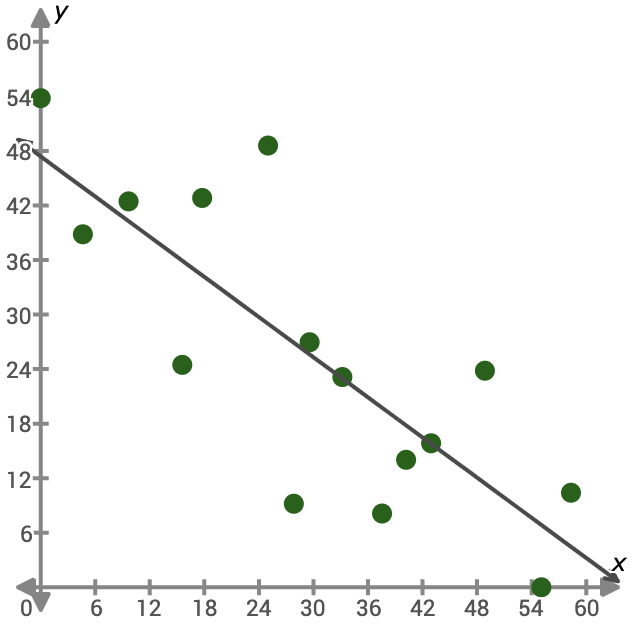
1 = a
2 = c
3 = b
4 = d
300
Using the box plot below, what percentage of the students scored higher than 85?
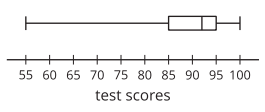
75%
400
Which of the following helps in finding the center of a box plot?
median
400
If we eliminate 11, what changes? List all the apply.
mean, range, max, IQR
400
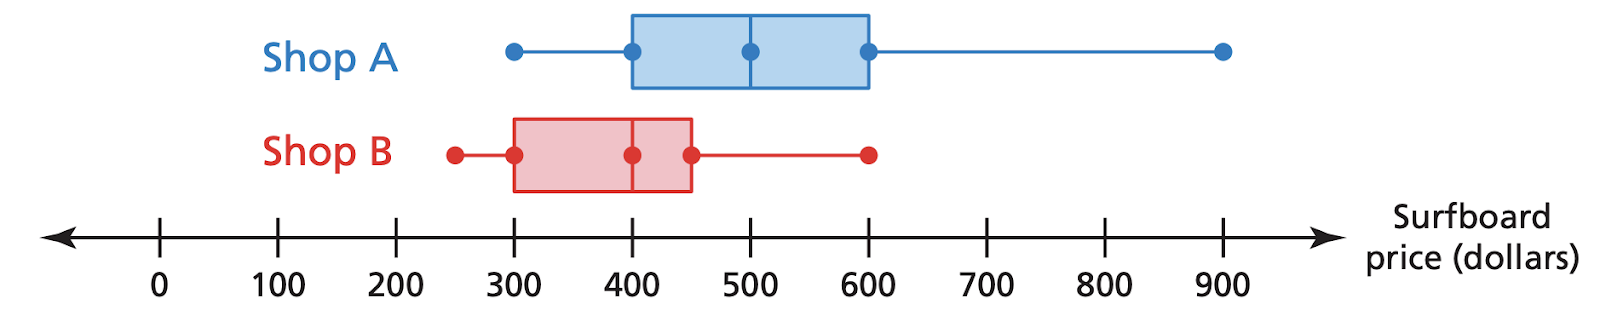
Two shops are comparing their prices. Circle all the true statements.
a.) 50% of Shop B’s surfboards are between $300 and $400.
b.) Shop A’s median is $100 more than Shop B’s median.
c.) Shop A has more surfboards than Shop B.
d.) The most expensive Surfboard in Shop A is $300 more than the most expensive Surfboard in Shop B.
e.) The range of prices for Shop A’s surfboards is $600.
f.) 25% of Shop B’s surfboards cost $400 or more.
b, d, e
400
Which of the following equations would be a best fit line for the scatter plot?
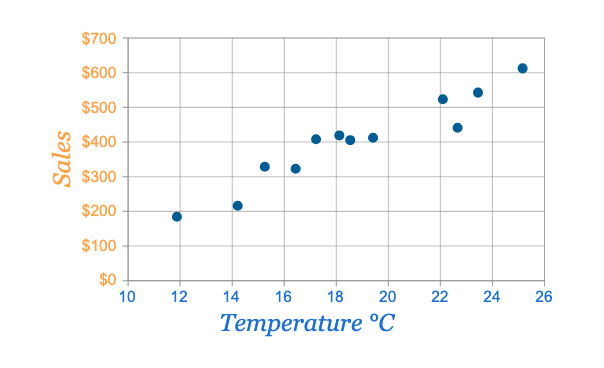
a) y = 0.53x + 99.34
b) y = 29.64x – 131.07
c) y = – 90.3x – 63
d) y = – 0.98x + 11.12
a
400
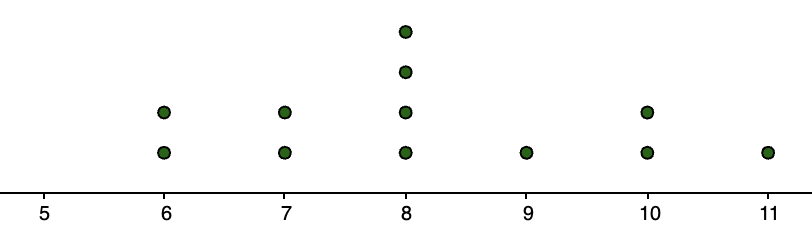
What is the distribution of the dot plot?

skewed left
500
Which of the following helps determine how spread out the data is on a distribution?
standard deviation
500
These values represent your past 10 direct deposits.
$630, $210, $580, $590, $697, $603, $634, $587, $559, $634
Create a box plot with the above information.
min = 210
max = 697
median = 596.5
Q1 = 580
Q3 = 634
500
Here are four bowling players with their scores. Select all the statements that are true.
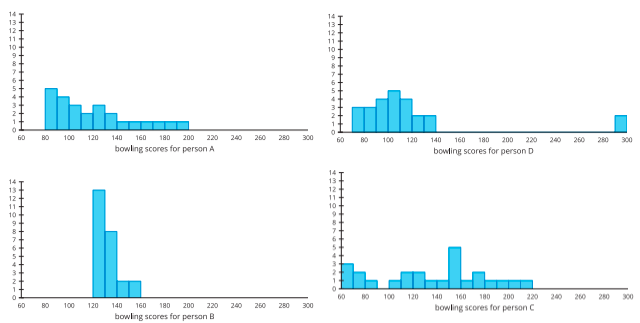
a) Person A always scored higher than person C
b) Person B has the highest variability out of all the bowlers
c) The range of person D is greater than the range of person C
d) Person A has the lowest minimum out of all the bowlers
e) Person D has the highest maximum out of all the bowlers
f)Person A has a greater standard deviation than person C
g) If we eliminate the outlier for person D, the median will change more than the mean.
h) If we eliminate the outlier for person D, the mean will change more than the median.
c, e, h
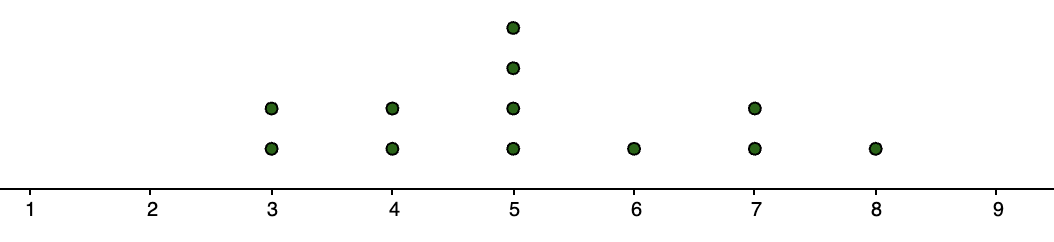
500
What is the distribution?
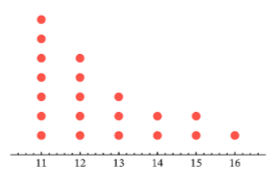
skewed right