1 or 2 variable?
Graph Type?
Graph Type?
-2 variable data
-Scatter Plot
Time taken to run 40 km and time spent training for the run?
I: time training
D: time to run 40 km
What correlation? Time spent studying vs. time spent playing video games.
What is negative?
Which scatter plot has a stronger correlation.
What is the second scatter plot?
This is the number of children Mrs. Blackburn has.
What is 2?
Marc records the brand of phones students have in this classroom.
-One variable
-Bar Graph/pie chart
The amount of pollution in the air and visibility score?
I: the amount of pollution
D: visibility score
What correlation? Driving over speed limit vs. number of speeding tickets received?
What is a positive Correlation?
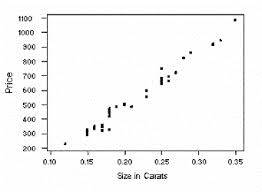
The line of best fit for this scatter plot has this y-intercept of about 250? True or False

True
The number of students enrolled in the classroom?
What is 22?
Josh conducts a music concert survey to determine how many concerts people see every year?
-One variable data
-bar graph, line graph, histogram
The reading level of a child and their age
I: age
D: reading level
What correlation? Distance of road trip vs. number of times you brush your teeth per day.
What is a no correlation?
True/False/. This is a good line of best fit?
True
Approximately 1/1
This is Mrs. Blackburn's favorite music to listen to?
Country
Number of years worked in a profession and annual income.
Two variable data
scatter plot
The size of a moving truck and the moving cost?
I: size of truck
D: moving cost
This is also called a trend line and is used to make predictions with scatter plots.
What is the line of best fit?
This is the expected sales if the temperature is 20 degrees Celsius. 
What is 450?
Percentage of girls enrolled in the classroom?
What is 45%
Time spent watching tv and number of snacks consumed.
Two variable data
scatter plot
Number of windows and building height?
I: Building Height
D: Number of Windows
When you are writing an equation for the line of best fit, how do you determine the y-intercept?
What is look at where the line cross the y-axis?
This is the time I should spend studying if I would like to get a 90% on the final. 
What is 8.5 hours?
Is Mrs. Blackburn the youngest or oldest child?