Association
Relative Frequency
Line of Best Fit
Two Way Tables
Vocabulary
100
What is another word of association?
Correlation
100
What is the total of people who want white bread?
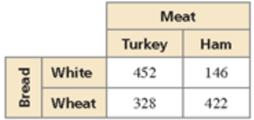
598
100
At the beginning of the day, how many customers did the restaurant have?
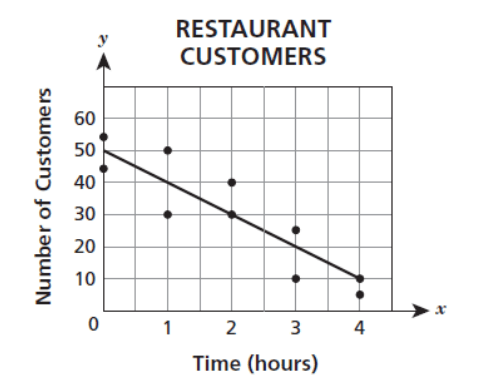
50
100
How many freshman are participating in the fundraiser? 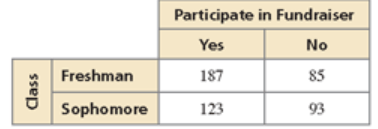
272 freshman
100
What is another word for trend line?
Line of Best Fit
200
What kind of association is this scatter plot?
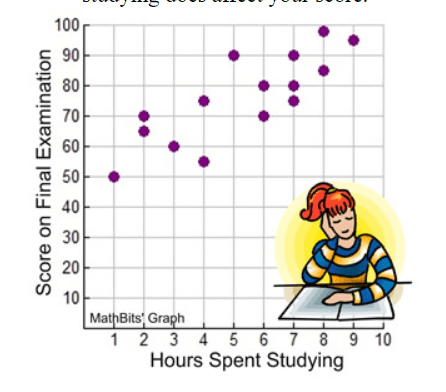
Positive Linear Association
200
What are the totals for yes and no?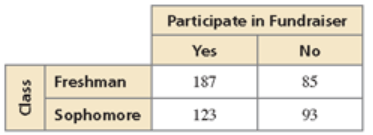
Yes: 310
No: 178
200
If the bill is $28, how many gallons is used?
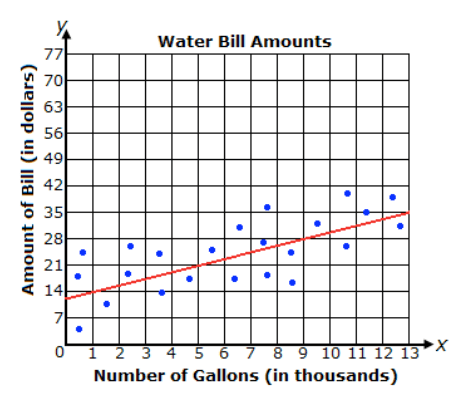
9000
200
How many people prefer a potluck lunch?

36
200
What type of tables are used for relative frequency?
Two-Way Tables
300
Describe the association of this scatter plot in context.
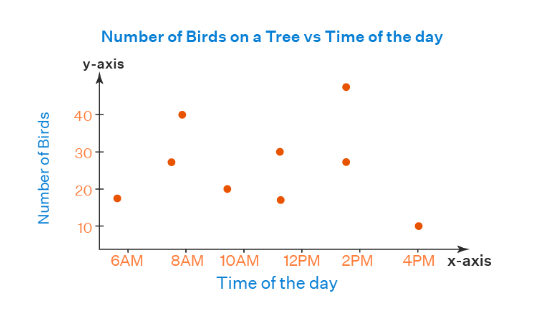
There is no association. The time of day does not affect the number of birds.
300
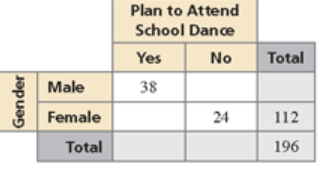
Complete the two way table.

300
How much does the Pizza store make after 30 pizzas?
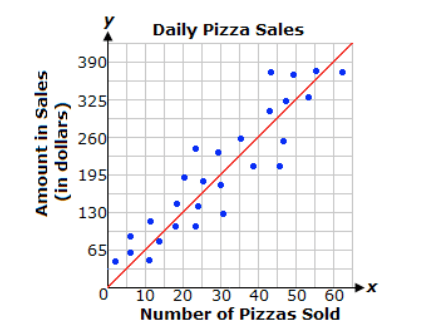
$195
300
How many people prefer a catered dinner?
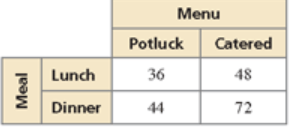
72
300
What are the three different types of association?
Positive, Negative, No
400
What kind of association is this situation?
Temperature and amount of clothes a person wears
Negative
400
Find the relative frequency of white bread with ham. Round to 1 decimal place.
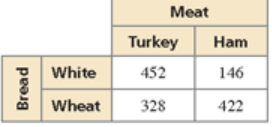
24.4%
400
What is the line of best fit? Round all coefficients to 1 decimal place.
y= 12.4x+31.6
400
How many students play sports? How many students do not play instrument?

Sports: 118
No Instrument: 147
400
How did do you find the relative frequency?
part / total * 100
500
What kind of association? Explain.
A baby's weight and age.
Positive
As age increases, the weight also increase.
500
What is the relative frequency of students that are female who did not attend the dance? Round to nearest tenth.
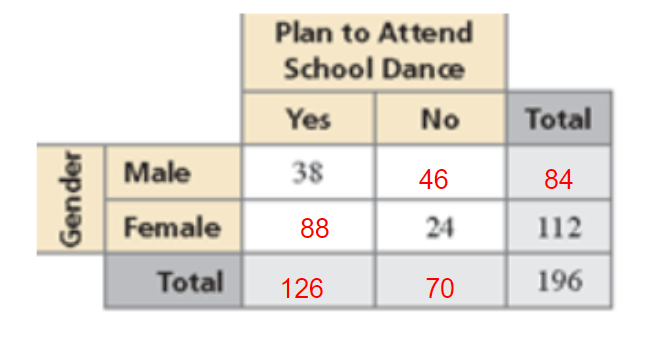
21.4%
500
Using the line of best fit (round everything to 1 decimal place), predict the how much minutes does a player have to play in order to get 2000 points.
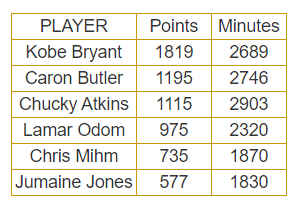
y=.8x+1544.2, x=2000
.8(2000)+1544.2= 3144.2
500
How many students play a sport and instrument, what is the relative frequency of students that play a sport and instrument? Round to 1 decimal place.
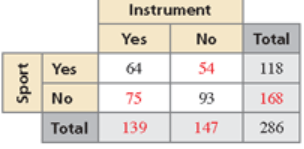
64 Students
22.4%
500
What are the steps to find the line of best fit on the TI-84 calculator?
STAT, ENTER, L1 = x, L2 = y
STAT, RIGHT, 4, ENTER X5