MMMR
Four Quartiles
What Are The Odds?
This AND That
What to Expect?
100
Abdoul tracked the scores of two high school basketball teams over the course of the season. Their Mean Absolute Deviations are below.
Wildcats: 12.5
Lions: 10.
Which team was more consistent?
Wildcats: 12.5
Lions: 10.
Which team was more consistent?
Lions- their average distance from the mean (MAD) was smaller
100
Each quartile represents what percent of the total data points?
25%
100
Which of the following probabilities are unlikely to occur?
46/50 1% 0.48 2/5 8/75 38%
1% .48 2/5 and 38%
100
If you flip a coin five times, what is the probability that you get tails 5 times in a row?
1/32
100
The theoretical probability of winning at least $1 on a scratch lotto ticket is 1/4. If you buy 100 tickets, on how many would you expect to win at least $1?
25
200
Which data set has the larger median? By how much?
Set A: 5, 9, 3, 6, 6
Set B: 120, 1, 0, 20, 63
Set A: 5, 9, 3, 6, 6
Set B: 120, 1, 0, 20, 63
Set B has a larger median by 14 (20-6 = 14)
200
Bridgeth was tallying the heights of kids who tried to ride a roller coaster one day. If she wanted to find the height that was taller than 75% of the kids who she surveyed, which quartile will she be looking at?
Quartile 3
200
For Halloween you get 12 Reeces Peanut Butter Cups, 8 Skittles, 4 Mounds Bars, and 8 Sour Patch Kids.
If you reach into the bag and pull out a random candy, what is the probability that you would pull either a Mounds bar OR a Sour Patch Kids?
Would this be likely, unlikely, certain, or impossible?
If you reach into the bag and pull out a random candy, what is the probability that you would pull either a Mounds bar OR a Sour Patch Kids?
Would this be likely, unlikely, certain, or impossible?
20/32 which = 5/8 . . . a likely outcome.
200
At a pizza shop you can order:
Regular or Deep Dish
Red Sauce or White Sauce
Pepperoni, Sausage, Veggie, or Cheese.
If you pick a random combination, what is the probability that you pick a regular pizza with red sauce and EITHER pepperoni, sausage, OR cheese?
Regular or Deep Dish
Red Sauce or White Sauce
Pepperoni, Sausage, Veggie, or Cheese.
If you pick a random combination, what is the probability that you pick a regular pizza with red sauce and EITHER pepperoni, sausage, OR cheese?
3/16
200
If you roll a 6-sided die 180 times, how many times would you expect to roll a 5 or a 6?
60 times
300
Comparing the ranges of two data sets is one way to compare variability across those two data sets.
Name two other ways you can compare variability across two data sets
Name two other ways you can compare variability across two data sets
Interquartile Range and Mean Absolute Deviation
300
Which data set is more variable? Why? 
Carl- the ranges are about the same, but Carl's Interquartile Range is much greater so the middle 50% of data points is more spread out.
300
There are 10 5th graders, 22 6th graders, 8 7th graders, and 4 8th graders out at recess. If you talked to a random student at recess, what is the chance that their are NOT a 5th grader OR an 8th grader?
30/44, which = 15/22
300
If you spin the spinner below and then flip a coin, what is the probability that you spin a red and flip a tails?

5/24
300
If you spin the spinner below and pick a card out of a deck 320 times, how many times would you expect to spin a green and pick a heart?
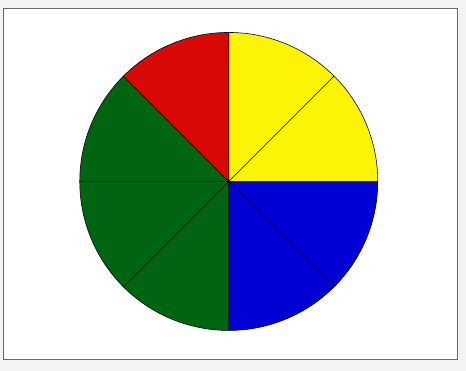
30 times (probability is 3/32)