Mean & MAD
Median and IQR
Box Plots
Data Sets
Misc.
100
What does each letter of MAD stand for?
Mean Absolute Deviation
100
Find the Median.
35, 56, 34, 44, 52, 12, 34, 45
(data is not in order)
35
100
What is the median number of eggs laid?

6
100
Describe the shape of this data

Skewed right
100
Is this question statistical or not statistical?
How many hours did each person in class sleep last night?
statistical
200
Find the mean of the data set:
10, 7 , 13, 10, 8
9.6
200
Find the IQR.
16, 24, 28, 32, 34, 38, 45
(data is in order)
IQR = 14
200

B
200
What is the median of this dot plot?
2
200
Find the Range. 3.2, 2.3, 2.2, 3.3, 3.3, 2.3, 3.2, 2.3, 2.2
Range = 1.1
300
If the mean is 9.6, find the MAD of the data set:
10, 7 , 13, 10, 8
1.68
300
Find the median:
45, 25, 35, 52, 38, 50, 48, 40
Median: 42.5
300
What was the lowest score earned on this math quiz?

20
300
What was the total number of dogs weighed for this data?
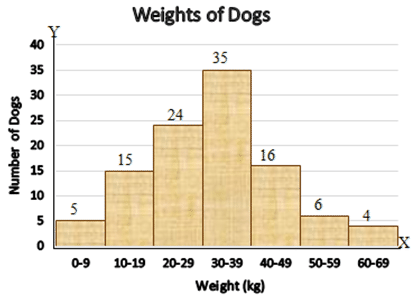
105
300
Find the Mode. 32, 23, 22, 33, 33, 23, 32, 23, 22
Mode = 23
400
Find the mean of the data set:
25, 35, 40, 45, 50
39
400
Find the IQR.
86, 24, 65, 65, 24, 24
IQR = 41
400
What percent of team members are older than 22?
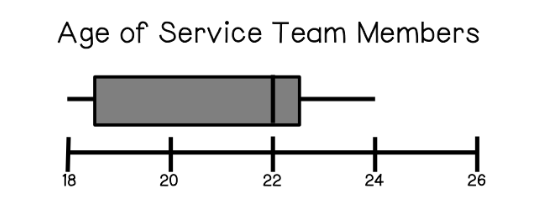
50%
400
How many dogs weight 30 kg or greater?
61
400
How many months was the puppy weighed for this data?
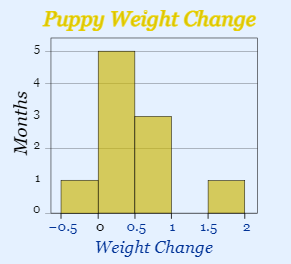
10
500
Find the MAD: 25, 35, 40, 45, 50
7
500
Find the IQR.
32, 23, 22, 33, 33, 23, 32, 23, 22
IQR = 10
500
What are the 5 pieces of data and the corresponding numbers needed from this data set to create a box and whiskers plot?
7, 4, 8, 2, 3, 7, 4, 8, 9, 2, 10, 8
Min: 2
Max: 10
Q1: 3.5
Q2: 7
Q3: 8
500
What is the median of this dot plot?

5
500
What percent of the months did the puppy gain weight?

90%