Mean&MAD
Median
Histograms and dot plots
Box Plots
Miscellaneous
100
Define mean
The mathematical average of two or more numbers
100
Define Median
the middle number in a data set when organized from least to greatest
100
Draw a histogram
100
Draw a box plot

100
True or False:
This is our last exam of the year
TRUE!!!
200
Find the mean for the following data set
3, 5, 7, 8
23/4 or 5.75
200
find the median for the following data set
3, 5, 6
5
200
what do histograms tell us
A. Frequency
B. Distribution
C. Mean
D. Median
A. Frequency
200
What are the 5 parts of a box and whiskers plot
Minimum, Q1, Median, Q3, Maxmimum
200
solve the following equation
5.5 X 12.1
66.55
300
Find the mean of the following data
9, 11, 12, 15, 19
66/5 or 13.2
300
find the median for the data set
6, 7, 8, 10, 12, 15, 19
10
300
what is the most frequent height of cherry trees according to the histogram
75
300

85
300
when we divide by fractions, what is the three word phrase we use to solve.
Keep, Change, Flip
400
Define MAD
the average distance every data point is away from the mean
400
find the median for the following data set
14, 21, 18, 20, 11, 13, 13
14
400
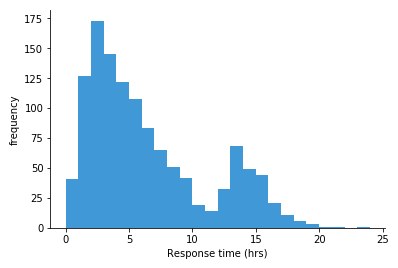
What is the most frequent response time according to the histogram?
3 hours
400
what is the minimum according to this box plot?
~68
(will accept answers between 66-69)
400
Find x to complete this equation:
3x=36
x=12
500
True or False: you need to find the median before finding the MAD.
FALSE: you need to find the MEAN before finding the MAD, not the median
500
find the median for the following data set
15, 11, 12, 9, 23, 43, 13, 10, 11, 31
12.5
500

What age likes M&Ms the most?
16-20 year olds
500
what is the Q3 value according to this box plot
~98
(will accept values between 95-99)
500
Find the IQR for this box plot (remember, to find IQR, you do Q3-Q1)
~30