Dot Plot & Box Plot
Relative Frequency/Variability
Histogram
Random
100
The fuel efficiencies of 10 cars are listed below in miles per gallon (mpg). Which box plot represents these data values?
32, 26, 14, 30, 29, 25, 30, 12, 40, 20


D
100
What is the relative frequency of RAP?
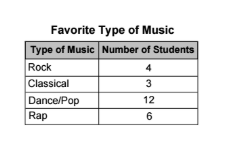
24%
100
True or False?
12 schools made between 900-1099 copies

TRUE
100
What two countries competed in the Olympics in 2026 for the Gold medal in both Men's and Women's Hockey?
USA vs Canada
200
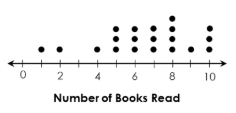
The dot plot below shows the number of books read by a group of 20 students over the summer.

What is the Range?
Range: 9
200
A survey of students at CPJH chose their favorite subject. What is the relative frequency of math

42%
200
If these schools both have the same number of students, which school had more students select "handing out with friends" as their favorite after school activity?
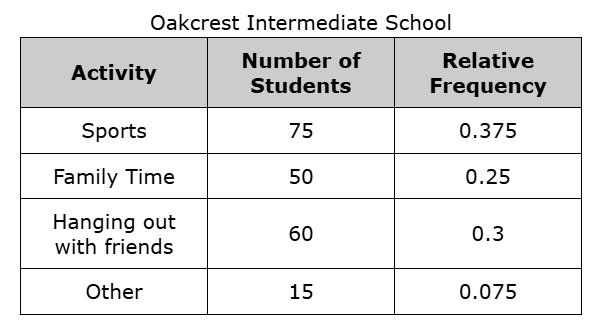
Oakcrest
200
What toy company started in Denmark in 1932 making wooden toys like pull-along ducks and small cars before eventually becoming one of the most famous toy brands in the world?

300
What is the IQR?
IQR: 3
300
The percentage bar graph shows the percentage of games won by each teacher’s class on field day.
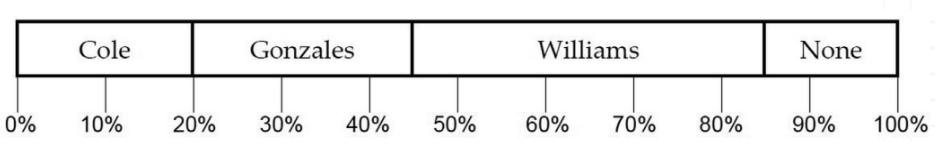
Which statement best supports the data in the percentage bar graph?
A Mrs. Gonzales’ class won more than half of the games.
B Mrs. None won 15% of the games.
C Mrs. Cole won 20 games.
D Mrs. Williams' class won 85% of the games.
B
300
What is the number of workers who's wages were over 60? 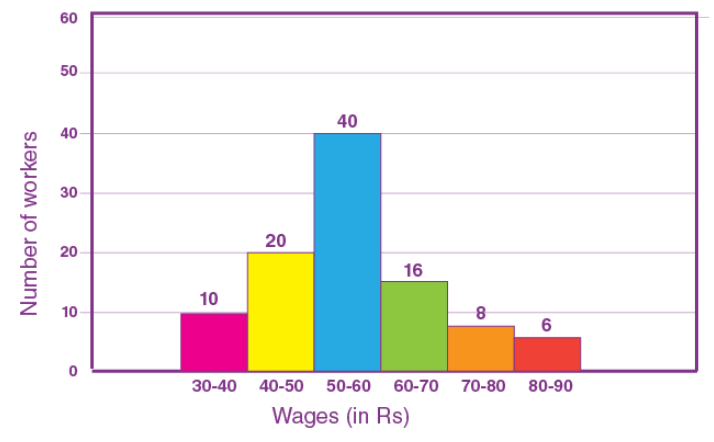
30
300
What metal is liquid at room tempereture?
Mercury

400
What is the median of the data?

4
400
What is the difference between the median of hot dogs sold and the median of hamburgers sold?
Medians
Hot dog: 7
Hamburger: 6
The difference is 7-6= 1
400
What is the relative frequency of workers with wages over 80?
6% or 0.06
400
Riddle: What has a face and two hands but no arms or legs?

500
Describe the data shape in the dot plot. (There can be more than one answer)

Asymmetrical
Skewed right
Peak at 2
Gap at 5
Cluster from 0 to 2
500
15 Which situations have variability? Select 2
The number of socks you wear every month
The length of a football field
The number of students present each day
The library fee for the first day a book is overdue
The number of socks you wear each month
The number of students present each day
500
What is the relative frequency of students who chose flute as their favorite instrument?
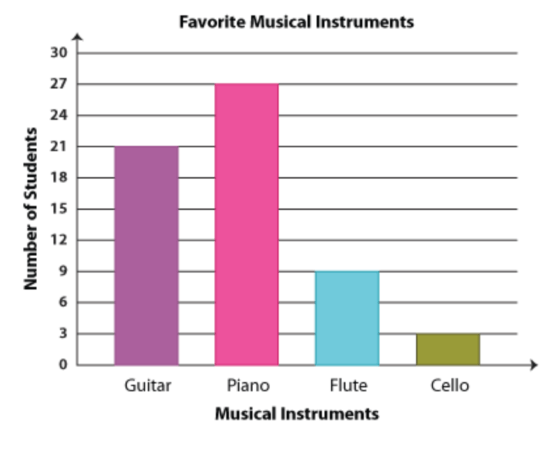
15% or 0.15
600
According to this historgram, how many schools made copies between 1,100 - 1,199?

6 schools