Data
Mean, Median, Mode & Range
Charts & Graphs
Extras
100
Types of transport to school:
a) Numerical Data
b) Categorical Data
Categorical Data
100
What is the mode of this data set?
4,5,1,6,8,3,6,4,6,5,6,4,2
6
100
What type of a graph is this?
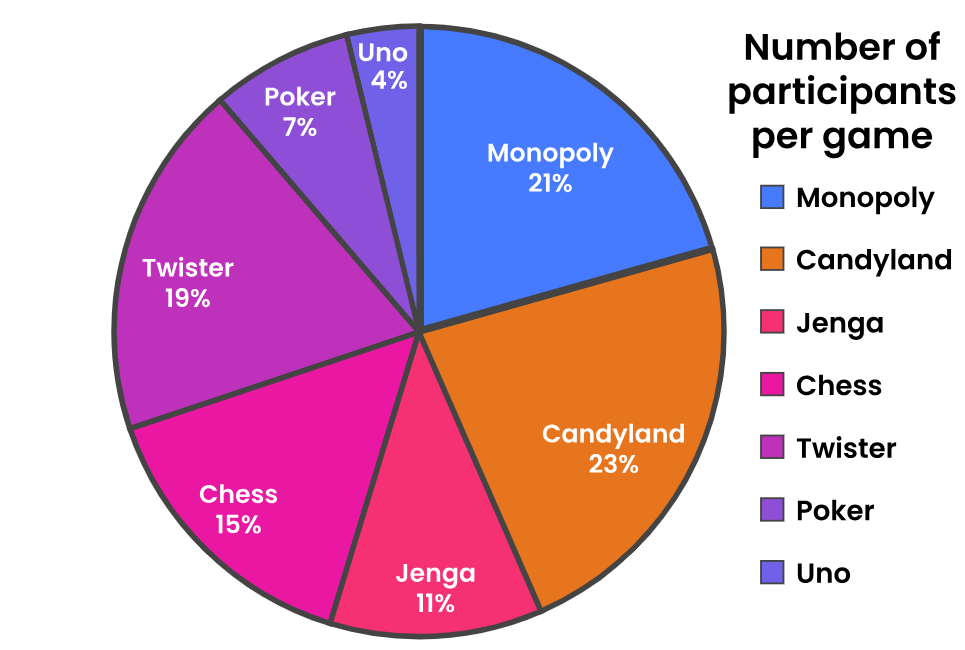
A Pie Chart
100
Find the Minimum, Q1, Median, Q3, Maximium
(100 points each)
8, 4, 10, 9, 10, 5, 6, 8, 6, 8,
12, 11, 10, 9, 6, 7, 10, 12, 10, 5
Min 4
Q1 6
Median 8.5
Q3 10
Max 12
200
Order this data set:4,7,2,6,9,5,5
2,4,5,5,6,9
200
What is the Range of this data set?
4,5,1,6,8,3,6,4,6,5,6,4,2
8 (maximum) - 1 (Minimum) = 7
200
A bar graph is used for what type of data?
Categorical
200
What is the name of the municipal council area
(City of .........................) that Sunshine College is in?
City of Brimbank
300
How could you collect data about people's favourite food?
1) Ask them
2) Survey them
300
What is the median of this data set?
4,5,1,6,8,3,6,4,6,5,6,4,2
5
300
What type of a graph is this?
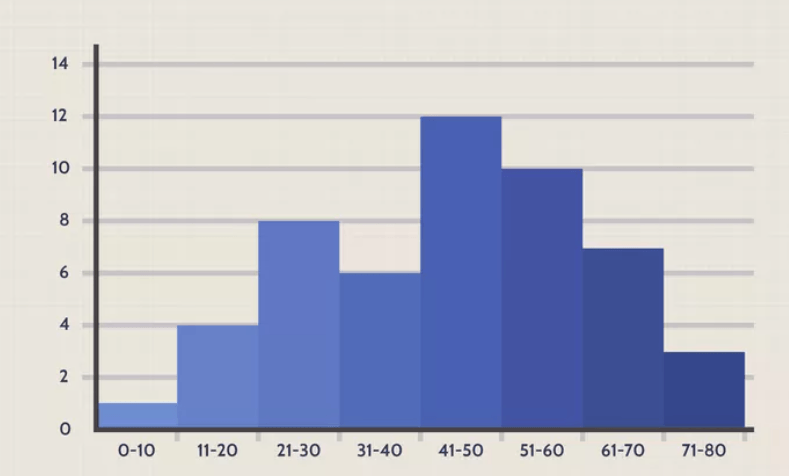
A Histogram
300
Who is the Prime Minister of Australia?
Anthony Albanese
400
What was the finishing order of the first four teams in the recent World Cup Football tournament?
Spain
England
Sweden
Australia
400
What is the Mean of this data set?
4,5,1,6,8,3,6,4,6,5,6,4,2
4.6
400
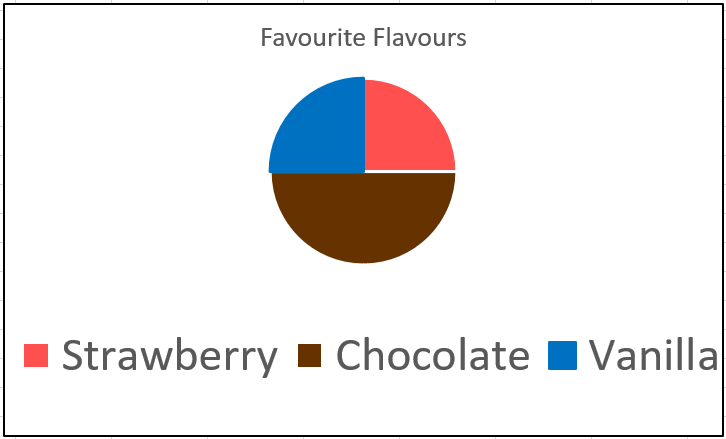
Draw a Pie Chart from this data:
Strawberry: 2
Chocolate: 4
Vanilla: 2
400
If 12 students out of a class of 20 use Snapchat as their favourite Social Media, give the proportion as:
1) a decimal
2) a percentage
3) a fraction in its simplest form
a) 0.6
b) 60%
c) 3/5
500
Give 3 facts from this graph:
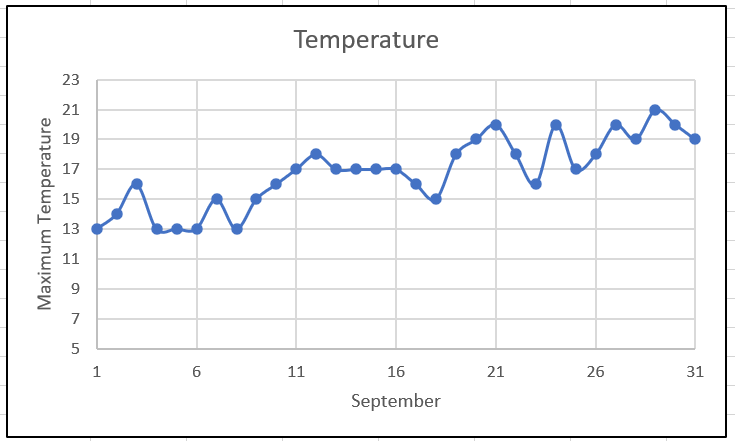
Temperature trend goes up
Hottest day was about 29th
13o was the coldest maximum
It is for September
500
What is Q1 and Q3 in this data set?
Q1 = 3.5
Q3 = 6.0
500
Name the four Metro Train stations after Sunshine on the way to the city.
Tottenham
West Footscray
Middle Footscray
Footscray
500
Give the 5 number summary (Min, Q1, Median, Q3, Max) for Class B
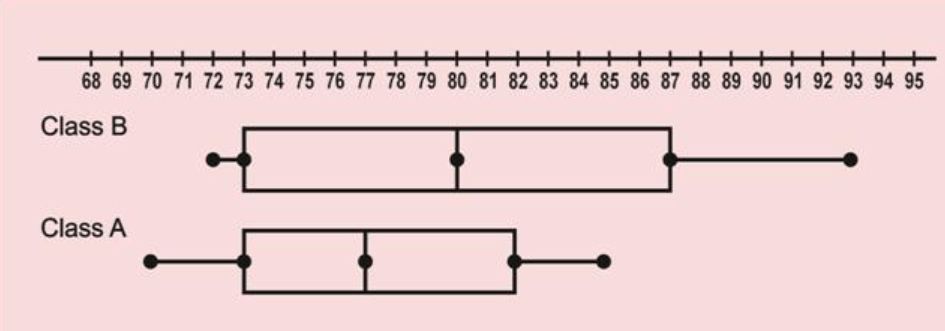
Min 72
Q1 73
Median 80
Q3 87
Max 93