Reading Venn Diagrams
Reading Two-Way Tables
Probability with Venn Diagrams
Probability with Two-Way Tables
100
How many people like maths and physics?

40
100
How many people like skateboards and snowmobiles?

80
100
What is the probability that a randomly chosen student likes both mathematics and physics?
40/100
4/10
2/5
200
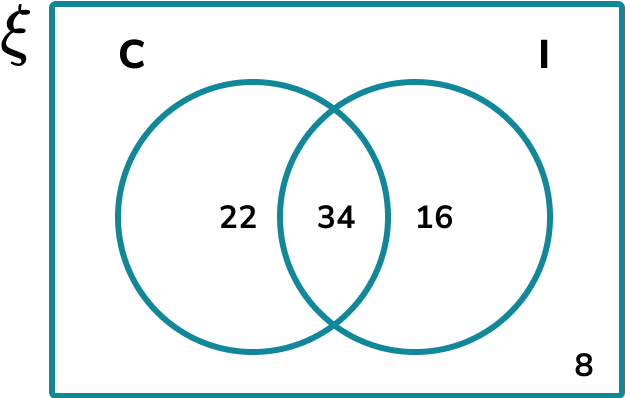
How many people do not like cookies or icecream?
8
200
How many people in total were surveyed?
240
200
What is the probability that a randomly chosen person does not like cookies or ice cream?
8/80
1/10
200
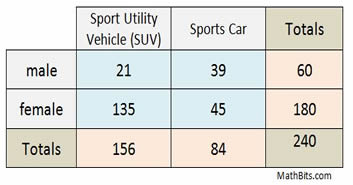
What is the probability that a randomly chosen person likes snowmobiles?
105/160
21/32
300
How many students like English but do not like Maths?
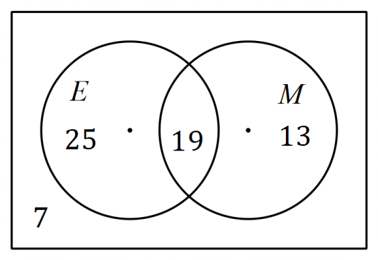
25
300
How many people in total like football?
42
300
What is the probability that a randomly chosen person likes football and likes chocolate?
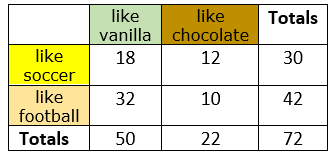
10/72
5/36
400
How many people like snowmobiles but do not like skateboards?
25
400
Given a student likes Mathematics, what is the probability that they also like physics?
40/70
4/7
400
Given a students eats breakfast, what is the probability that they are aged 14-17? 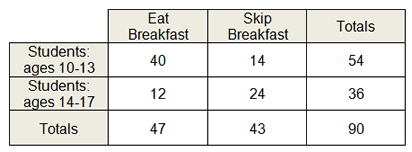
12/47
500
How many people like mathematics or physics or both?
90
500
What is the probability that a randomly chosen student likes English, given that they also like Mathematics
19/32
500
What is the probability that a person likes chocolate, given that they like soccer?
12/30
6/15
2/5