Stem-and-leaf Plots
Mean, Median, Mode and Range
The shape of distribution
Classifying Data
Pot luck
100
How many females responded to this survey?
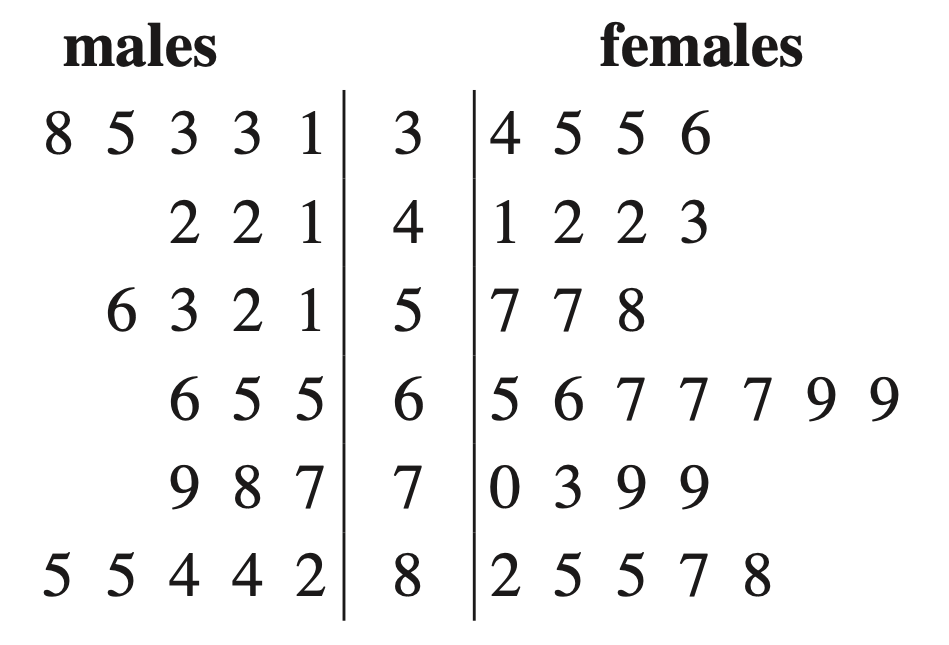
27
100
Describe what 'Mode' is.
The score that occurs most often
100
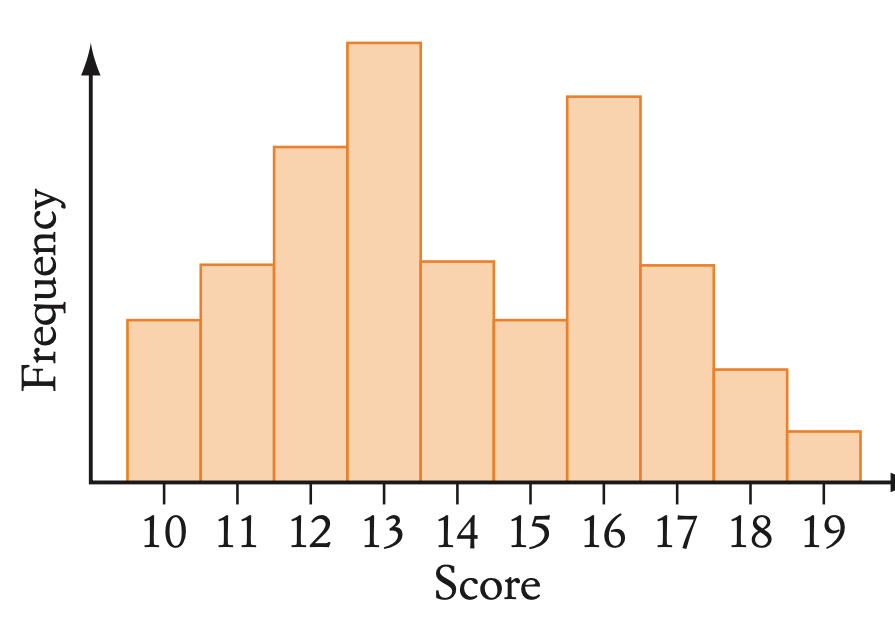
Describe the shape of the distribution.
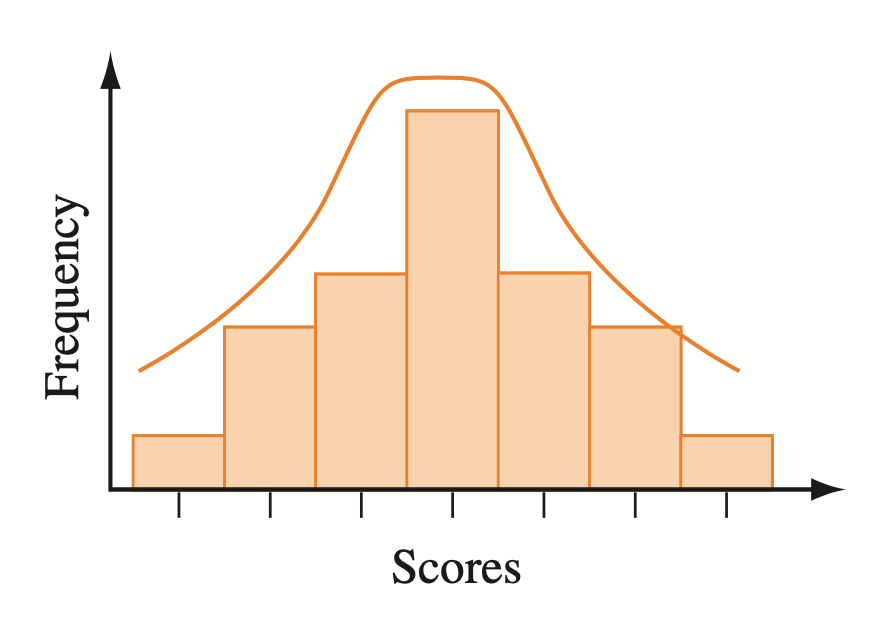
Symmetrical
100
The height of students
Numerical Continuous
100
List out Measure of Central Tendency
Mean, Mode, Median
200
Find the mode and the range.
Mode = 58
Range = 42
200
Find the mean of the following set of data to 1 decimal place:
13.5, 14.2, 11.9, 15.7, 18.4, 17.6, 12.0
Mean = 14.8
200
What is the mode for the following?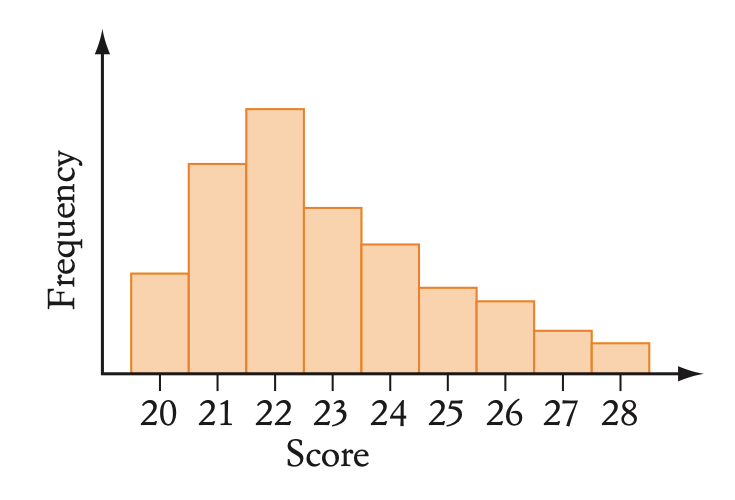
22
200
Number of chairs in the room
Numerical Discrete
200
What does range calculate?
The measure of spread of a data set
300
Form an ordered stem-and-leaf plot based on the following set of data
11, 22, 27, 31, 37, 39, 41, 44, 46, 46, 49, 50, 52
Teacher to decide :)
300
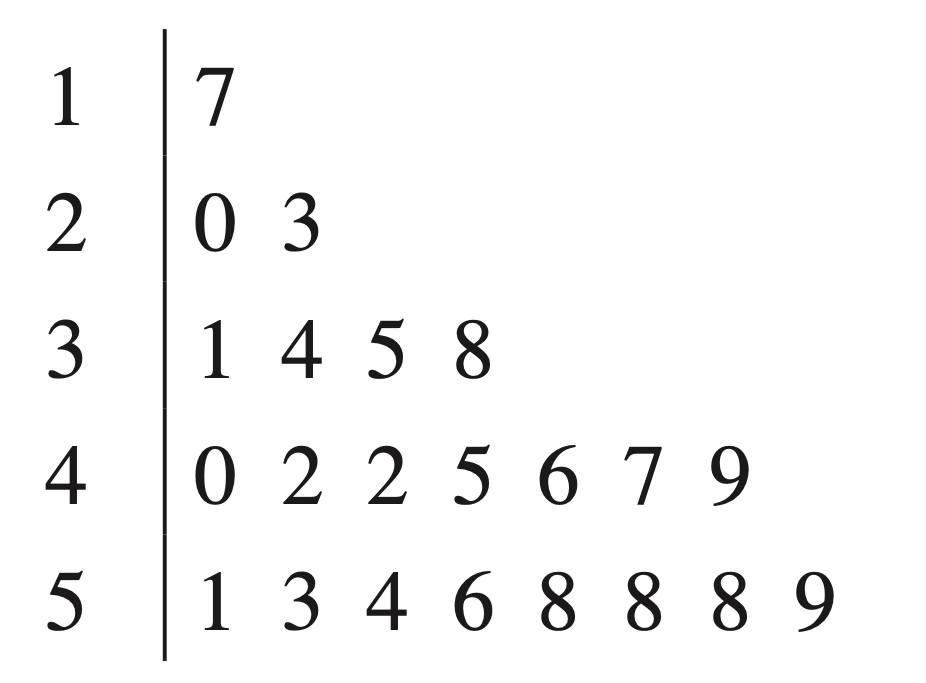
Find the median of the following set of data:
5, 3, 8 ,7 ,1 ,6, 7, 7, 5, 15, 12
Median = 7
300
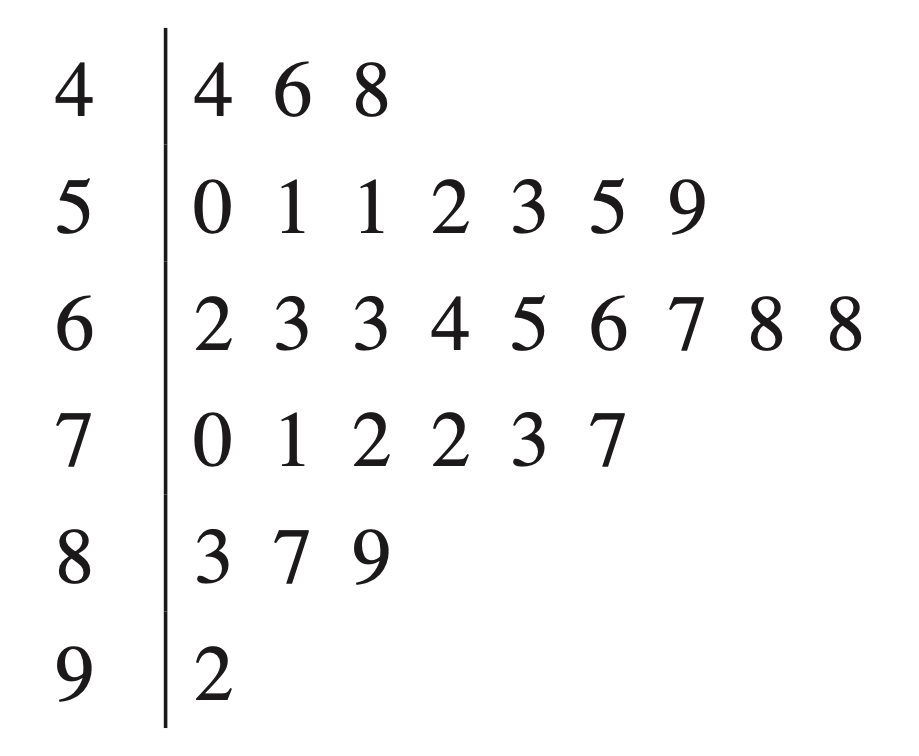
What is the range for the following data?

72
300
Colours of cars
Categorical Nominal
300
Difference between range and IQR
Range is impacted by outliers. IQR takes middle 50% of the data
400
Find the upper and lower quartile of the following set of data.
Lower Quartile = 52.5
Upper Quartile = 72
400
Find the median, mean and range of the following set of data:
-5, 0, -2, 4, 6, -2, 5, -1, -2, 0
Median = -0.5
Mean = 0.3
Range = 11
400
How many modes are in this distribution?
2
400
Shoe size
Numerical discrete
400
List the 5 number summary
min, Q1, median, Q3, max
500
The following stem-and-leaf plot shows the marks for the class 10F and the class 10M. Find the median for both classes. 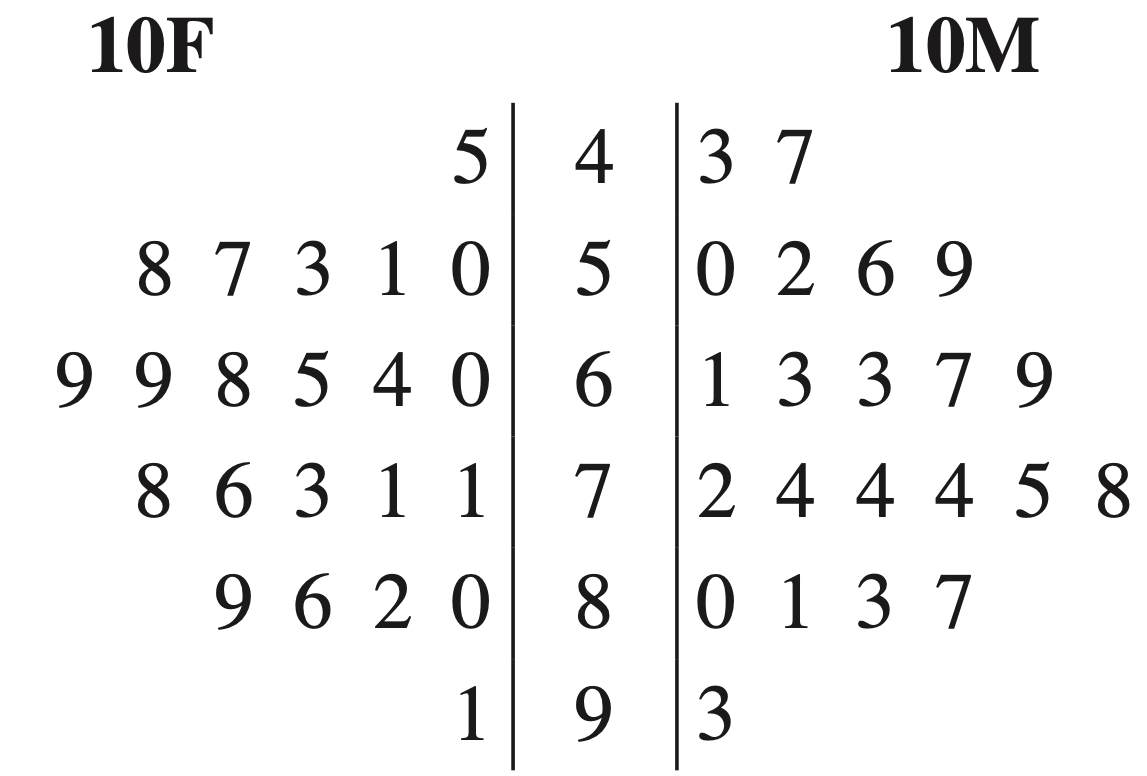
10F:69
10M: 70.5
500
Natasha scored a mean of 74 for 5 maths tests that she completed. What was the total number of marks that Natasha scored across all 5 maths tests?
370
500
Which of the following statements is true about this set of data: A) The mode for Girls is 67 B) There is more data collected for Boys than for Girls. C) The range for Girls is equal to the range for Boys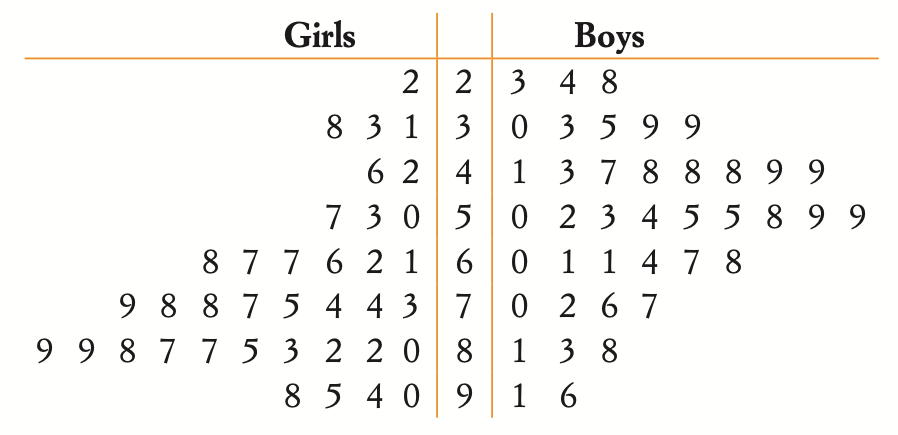
B
500
Olympic medals
Categorial Ordinal
500
Features of frequency histogram and frequency polygon
- Half a column width before and after histogram
- Polygon starts and end at 0
- Polygon touches the middle of the histogram columns