Histograms
Boxplots
Mean/Median/Mode
Range/IQR
Sampling
100
What does the height of a bar represent in a histogram when all class widths are equal?
Frequency
100
What are the five-number summary values used to construct a boxplot?
Minimum, lower quartile, median, upper quartile and maximum.
100
What do we call the most frequently occurring value in a data set?
Mode
100
How do you calculate the range?
Max-Min
100
What is a sample?
A smaller group selected from a population to collect data about it.
200
In a histogram, should there be gaps between the bars?
No, the bars touch except for the first
200
What does the line inside the box represent?
Median (Q2)
200
Find the median: 3, 5, 7, 9, 11.
7
200
Find the range: 6, 9, 12, 15, 20.
14
200
What is the entire group a researcher wants to investigate called?
The population
300
What is the shape?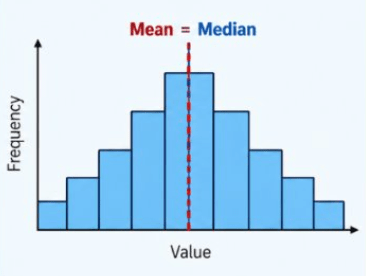
Symmetrical
300
What is the 5 number summary for group A
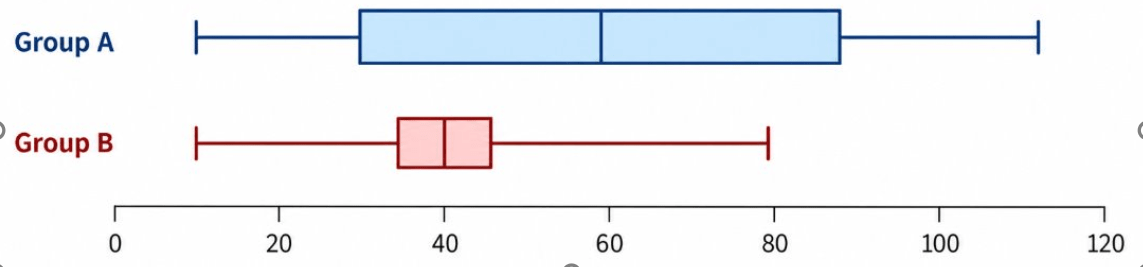
Min: 10, Q1:25, Q2:60, Q3:90, Max:110
300
Find the mean: 4, 6, 8, 10.
7
300
What does IQR stand for?
Interquartile Range
300
A teacher selects every fifth student on a class list. What sampling method is this?
Systematic Sampling
400
What shape is this?
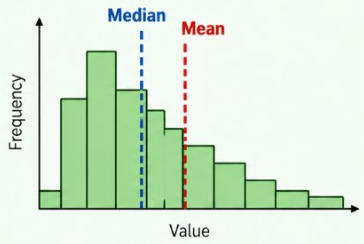
Positive Skewed
400
What is the 5 number summary of Group B:
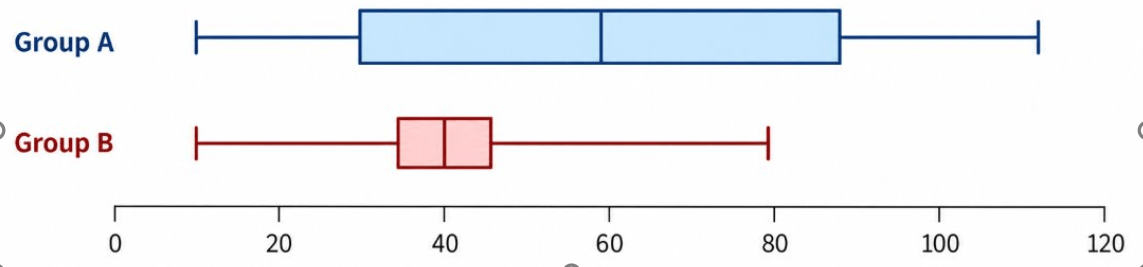
Min:10, Q1:35, Q2:40, Q3:45, Max:80
400
Find the mode: 2, 4, 4, 5, 6, 6, 6, 8.
6
400
If Q1=14 and Q3=32, calculate the IQR.
18
400
A student surveys only their five best friends to find out what music all Year 7 students enjoy. What is one problem with this sample?
It may be biased and not representative of all Year 7 students.
500
What shape is this?
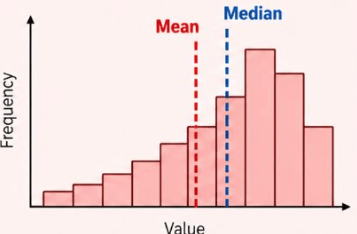
Negative Skewed
500
What does a small box mean in a box plot? Is the data more or less consistent?
More consistent if the box is smaller
500
The mean of five numbers is 12. Four numbers are 8, 10, 14 and 15. What is the fifth number?
60-(8+10+14+15)=13
500
Which is less affected by outliers: the range or the IQR?
The IQR, because it measures the spread of the middle 50% of the data.
500
A school has 600 students across Years 7–12. A researcher randomly selects 10 students from each year level. What sampling method is this?
Stratified random sampling.