Identifying
3.1
3.2
3.3
Review
100
The variable that you want to predict (y-values.)
__________
Response Variable
100
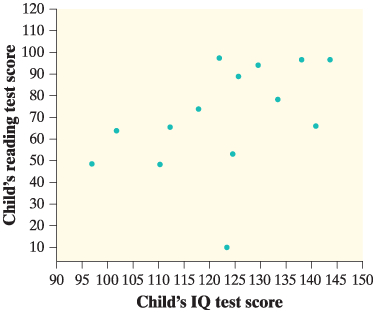
If we leave out the point (124, 10), the correlation for the remaining 13 points in the scatterplot is closest to:
A.) 0.95
B.) -0.65
C.) 0.65
D.) 0
E.) -0.95
C.) 0.65
100
We investigated the relationship between x = payroll (in millions of dollars) and y = number of wins for Major League Baseball teams in 2016. Given is a scatterplot of the data, along with the regression line ŷ= 60.7 + 0.139x.
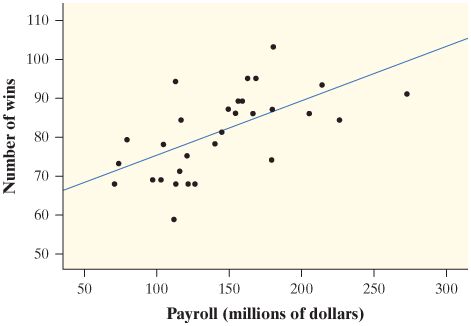
Predict the number of wins for a team that spends $200 million on payroll.
A.) 88.5 wins
B.) 32.9 wins
C.) 3.92 wins
D.) 12140.14 wins
E.) 1002.16 wins
A.) 88.5 wins
100
A scatterplot of y versus x shows a positive, nonlinear association. Two different transformations are attempted to try to linearize the association:using the logarithm of the y-values and using the square root of the y-values. Two least-squares regression lines are calculated, one that uses x to predict log(y) and the other that uses x to predict √y.
Which of the following would be the best reason to prefer the least-squares regression line that uses x to predict log(y)?
A.) The residual plot has more random scatter.
B.) The value of r² is smaller.
C.) The slope is greater.
D.) The distribution of residuals is more Normal.
E.) The standard deviation of the residuals is smaller.
A.) The residual plot has more random scatter.
100
A school guidance counselor examines how many extra curricular activities students participate in and their grade point average. The guidance counselor says, "The evidence indicates that the correlation between the number of extracurricular activities a student participates in and his or her grade point average is close to 0."
Which of the following is the most appropriate conclusion?
A.) Students with good grades tend to be students who are not involved in many extracurricular activities.
B.) Students involved in many extracurricular activities tend to be students with poor grades.
C.) No conclusion should be made based on the correlation without looking at a scatterplot of the data.
D.) Students involved in many extracurricular activities are just as likely to get good grades as bad grades.
E.) Students with good grades tend to be students who are involved in many extracurricular activities.
C.) No conclusion should be made based on the correlation without looking at a scatterplot of the data.
200
What does DUFS stand for?
Direction, Unusual points (possible outliers), Form, Strength (strong/moderate/weak)
200
Manatees are large, gentle, slow-moving sea creatures found along the coast of Florida. Many manatees are injured or killed by boats. Here is a scatterplot showing the relationship between the number of boats registered in Florida in thousands) and the number of manatees killed by boats for the years 1977 to 2015.
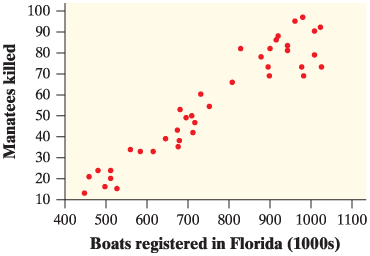
Which of the following is the most likely value of r? Is r > 0 or r < 0? Closer to r = 0 or r = +/- 1?
A.) r = 0
B.) r = 0.34
C.) r = -0.34
D.) r = 0.94
E.) r = -0.94
D.) r = 0.94
200
Here are the 40-yard-dash times (in seconds) and long-jump distances (in inches) for a small class of 12 students:
------------------------------------------
Dash time (sec): 5.41 5.05 7.01 7.17 6.73 5.68
Long-jump distance (in.): 171 184 90 65 78 130
----------------------------------------------
Dash time (sec): 5.78 6.31 6.44 6.50 6.80 7.25
Long-jump distance (in.): 173 143 92 139 120 110
----------------------------------------------
Sketch a scatterplot of the data using dash time as the explanatory variable.
A.) 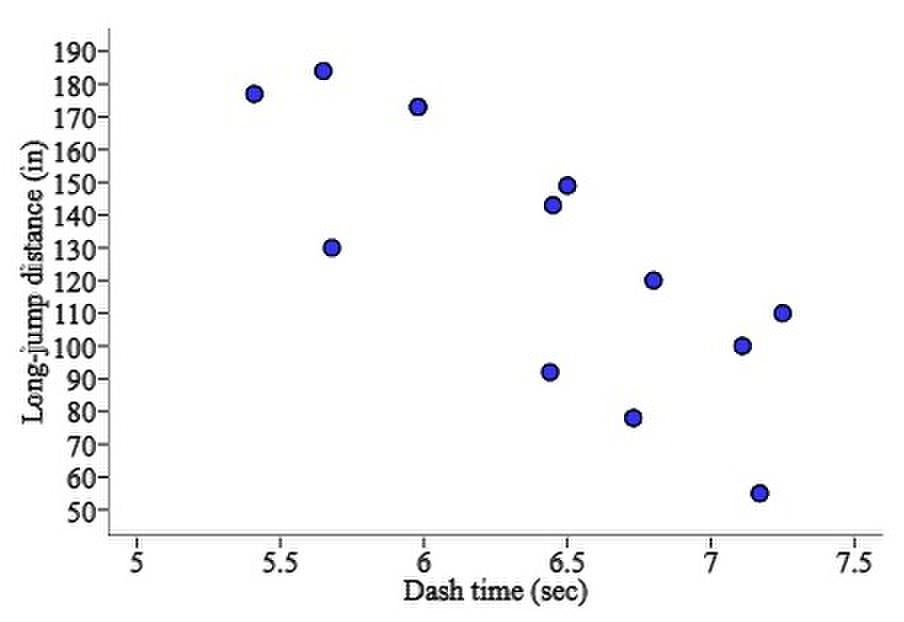 B.)
B.) 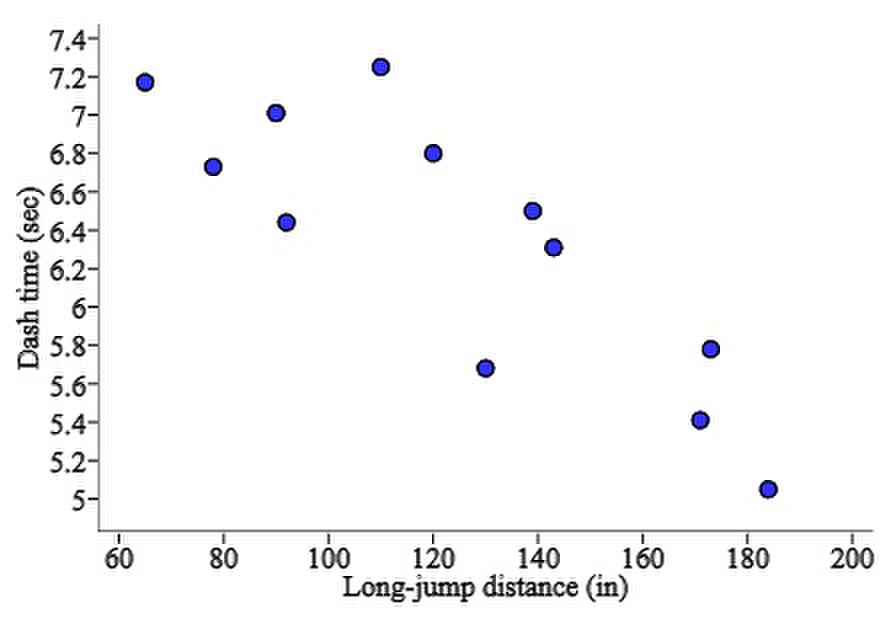 C.)
C.) 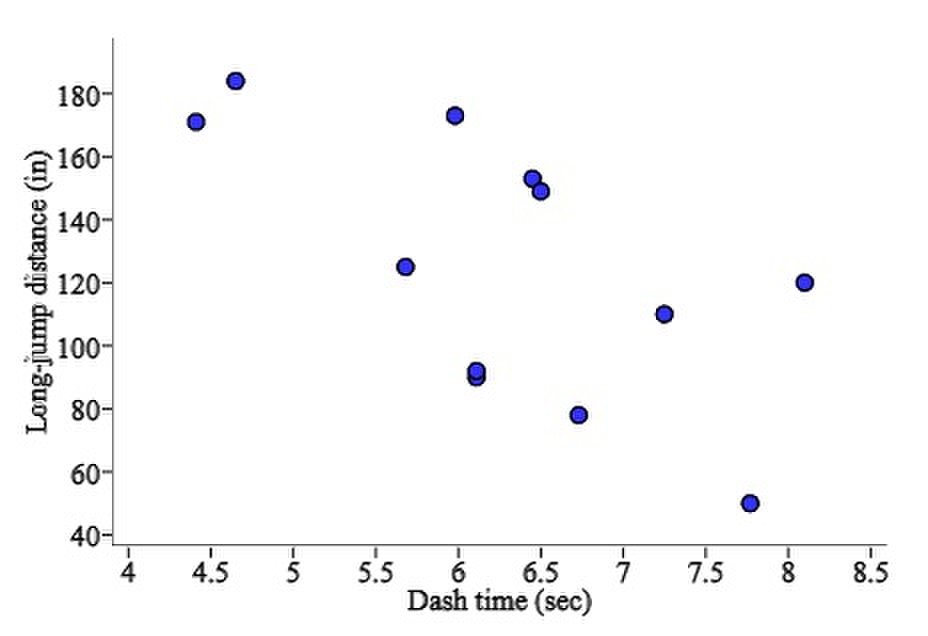 D.)
D.) 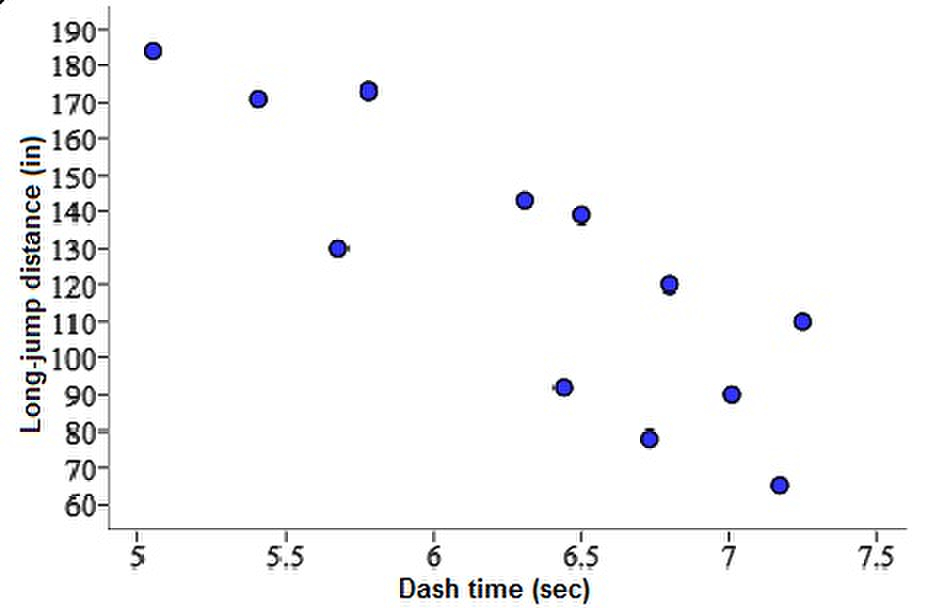 E.)
E.) 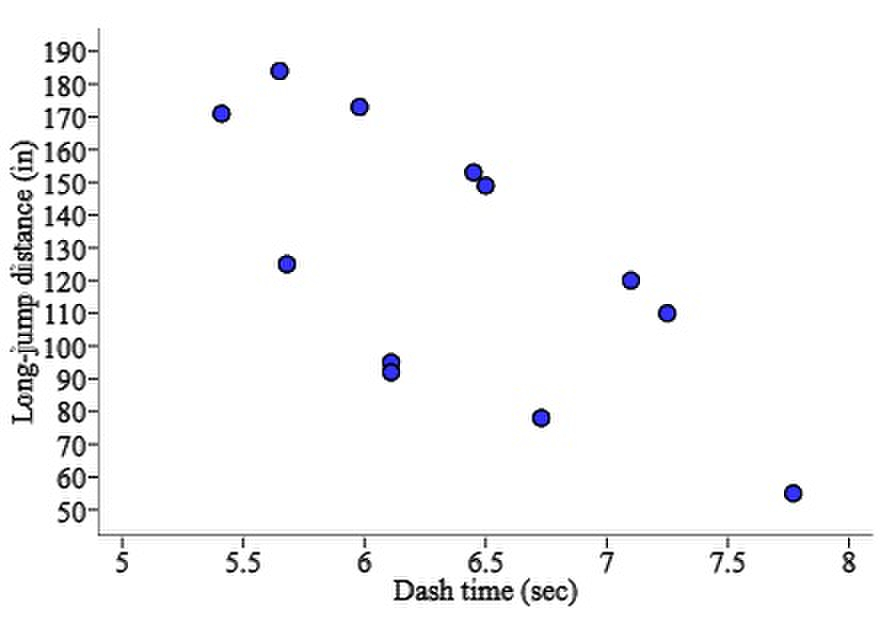
D.)
200
What does a correlation coefficient of r=0.82 indicate?
A.) A weak negative linear relationship.
B.) A strong positive linear relationship.
C.) No linear relationship.
D.) A perfect correlation.
E.) The variables are unrelated.
B.) A strong positive linear relationship.
200
Which of the following statements is NOT true of the correlation r between the lengths (in inches) and weights ( in pounds) of a sample of brook trout?
A.) r would not change if we measured the lengths of the trout in centimeters instead of inches.
B.) r would not change if we measured the weights of the trout in kilograms instead of pounds.
C.) If longer trout tend to also be heavier, then r >0.
D.) r must be a value between -1 and 1>
E.) r is measured in inches.
E.) r is measured in inches
300
The weight gain of corals in aquariums where the water temperature is controlled at different levels. What are the Explanatory and Response Variables?
Explanatory Variable: water temperature
Response Variable: weight gain of coral
300
True or false. Correlation equals causation.
False
300
The relationship between x=temperature in degrees Fahrenheit and y=chirps per minute for the striped ground cricket, is summarized with the regression line ŷ=-0.31+0.212x. For this model, technology gives s=0.97 and r²=0.697.
Interpret the value of r².
A.) There is a moderate, positive, linear association between number of chirps and the temperature in degrees Fahrenheit.
B.) The regression line model predicts for each degree increase in Fahrenheit there is about 69.7% increase in the number of chirps.
C.) About 69.7% of the number of chirps is accounted for by the least-squares regression line with x=temperature in degrees Fahrenheit.
D.) About 69.7% of the variability in temperature in degrees Fahrenheit is accounted for by the least-squares
regression line with x=number of chirps.
E.) About 69.7% of the variability in number of chirps is accounted for by the least-squares regression line with x=temperature in degrees Fahrenheit.
E.) About 69.7% of the variability in number of chirps is accounted for by the least-squares regression line with x=temperature in degrees Fahrenheit.
300
If the regression line predicts ŷ=60, but the actual y=65, what is the residual?
A.) -5
B.) 5
C.) 60
D.) 65
E.) 0
B.) 5
Residual=Actual-Predicted=65-60=+5
300
There is a linear relationship between the number of chirps made by the striped ground cricket and the air temperature. A least-square fit of some data collected by a biologist gives a model ŷ=25.2 + 3.3x, where x is the number of chirps per minute and ŷ is the estimated temperature in degrees Fahrenheit.
What is the predicted increase in temperature for an increase of 5 chirps per minute?
A.) 25.2 F
B.) 3.3 F
C.) 41.7 F
D.) 28.5 F
E.) 16.5 F
E.) 16.5 F
400
If women always married men who were 2 years older than themselves, what would be the correlation between the ages of husband and wife?
A.) 0
B.) 0.5
C.) 1
D.) Can't tell without seeing the data
E.) 2
C.) 1
400
Infants who cry easily may be more easily stimulated than others. This may be a sign of higher IQ. Child development researches explored the relationship between the crying of infants 4 to 10 days old and their IQ test scores at age 3 years. A snap of a rubber band on the sole of the foot caused the infants to cry. The researchers recorded the crying and measured its intensity by the number of peaks in the most active 20 seconds.
Does the fact that r=0.45 suggest that making an infant cry will increase his or her IQ later in life?
A.) Yes, it is likely. There is a correlation between crying and IQ later in life and correlation implies causation.
B.) No. There is a weak, positive association, which is not strong enough to conclude that an increase in the number of times an infant cries is likely to cause higher IQ scores later in life.
C.) Yes. Since there is a positive association, an increase in the number of times an infant cries will cause higher IQ scores later in life.
D.) Probably not. It is likely that both of these variables are changing due to several other variables, such as the baby's alertness or irritability.
E.) Yes, it is likely. Although there is a somewhat weak, positive association, an increase in the number of times an infant cries is likely to cause higher IQ scores later in life.
D.) Probably not. It is likely that both of these variables are changing due to several other variables, such as the baby's alertness or irritability.
400
We expect that students who do well on the midterm exam in a course will usually do well on the final exam. Gary Smith of Pomona College looked at the exam scores of all 346 students who took his statistics class over a 10-year period. Assume that both the midterm and final exam were scored out of 100 points.
State the equation of the least-squares regression line off each student scored the same on the midterm and the final.
A.) ŷ=346+x where ŷ=predicted grade on final and x=grade on midterm.
B.) ŷ=x, where ŷ=predicted grade on midterm and x=grade on final.
C.) ŷ=x̂, where ŷ=predicted grade on final and x=grade on midterm.
D.) ŷ=x̄, where ŷ=predicted grade on final and x=grade on midterm.
E.) ŷ=x, where ŷ=predicted grade on final and x=grade on midterm.
E.) ŷ=x, where ŷ=predicted grade on final and x=grade on midterm.
400
Which of the following best describes the meaning of r²=0.76?
A.) The line has a slope of 0.76.
B.) 76% of the values of y are correct.
C.) 76% of the variation in y is explained by x.
D.) 76% of x is predicted by y.
E.) The correlation is 0.76.
C.) 76% of the variation in y is explained by x.
400
When we standardize the values of a variable, the distribution of standardized values has mean 0 and standard deviation. Suppose we measure two variables X and Y on each of several subjects. We standardize both variables and then compute the least-squares regression line. Suppose the slope of the least-squares regression line is -0.44.
We may conclude that
A.) The correlation will be 1/-0.44.
B.) The correlation will also be -0.44.
C.) The intercept will also be -0.44.
D.) The correlation will be 1.0.
E.) The intercept will be 1.0.
B.) The correlation will also be -0.44.
500
In a scatterplot of the average price of a barrel of oil and the average retail price of a gallon of gas, you expect to see:
A.) a weak positive association
B.) very little association
C.) a strong negative association
D.) a strong positive association
E.) a weak negative association
D.) a strong positive association
500
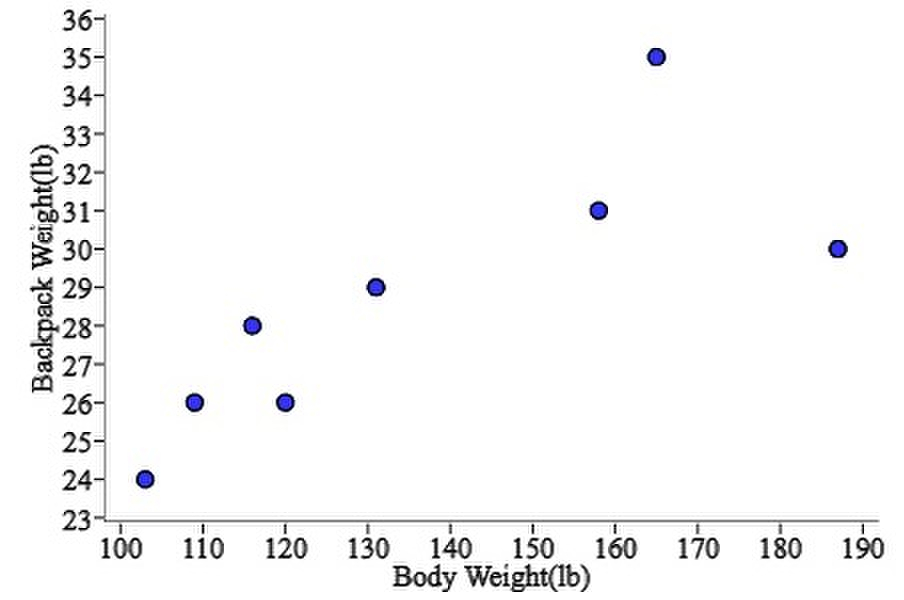
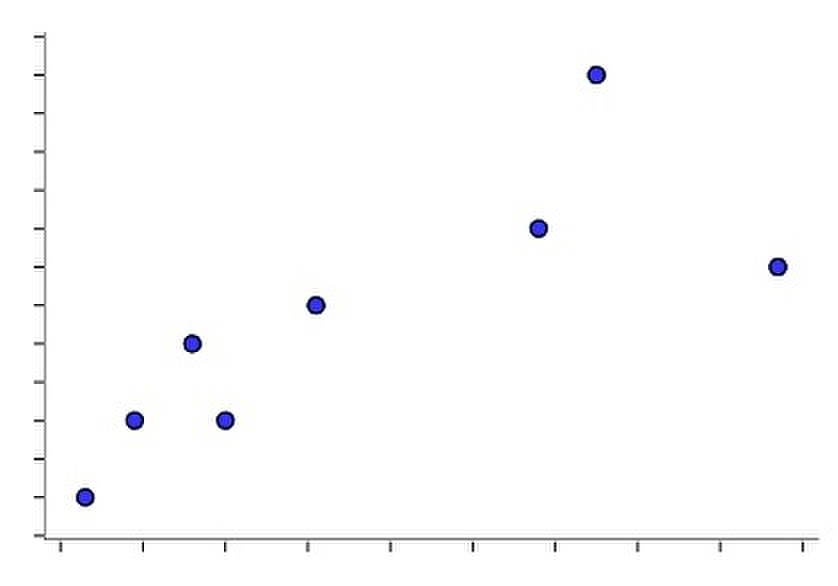
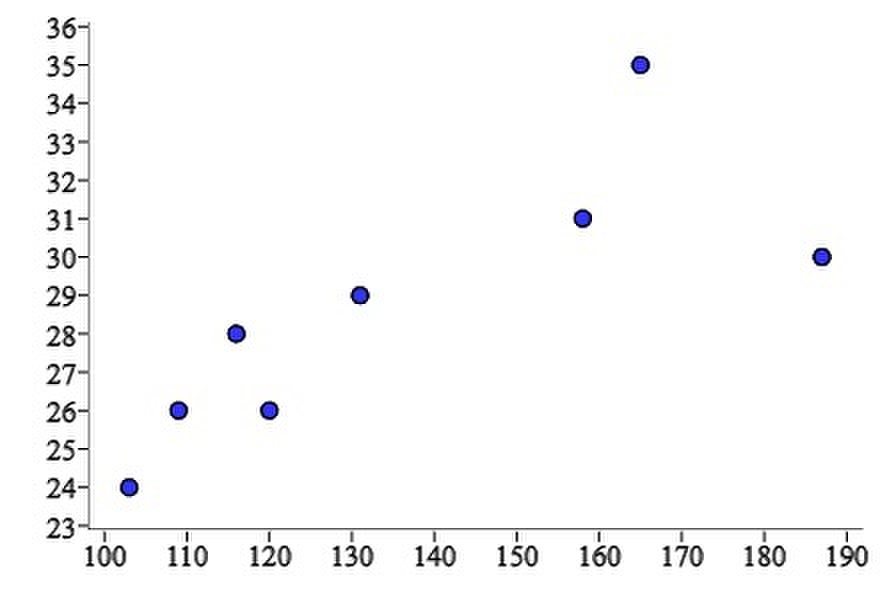
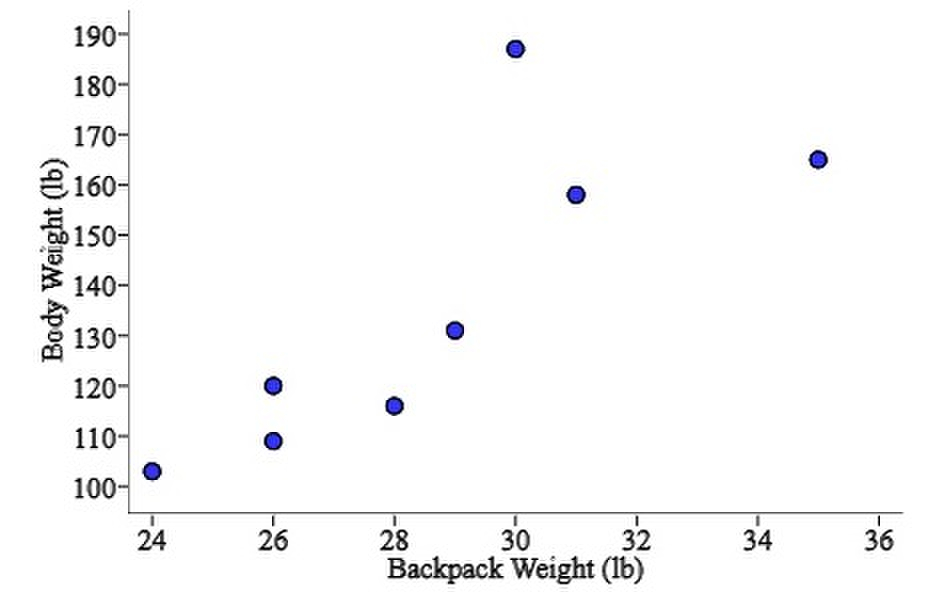
Ninth-grade students at the Webb Schools go on a backpacking trip each fall. Students are divided into hiking groups of size 8 by selecting names from a hat. Before leaving, students and their backpacks are weighed. The data here are from one hiking group.
Body weight: 120, 187, 109, 103, 131, 165, 158, 116
Backpack weight: 26, 30, 26, 24, 29, 35, 31, 28
Identify the correct scatterplot that shows how backpack weight relates to body weight.
A.)
 B.)
B.)
 C.)
C.)
 D.)
D.)
 E.)
E.) 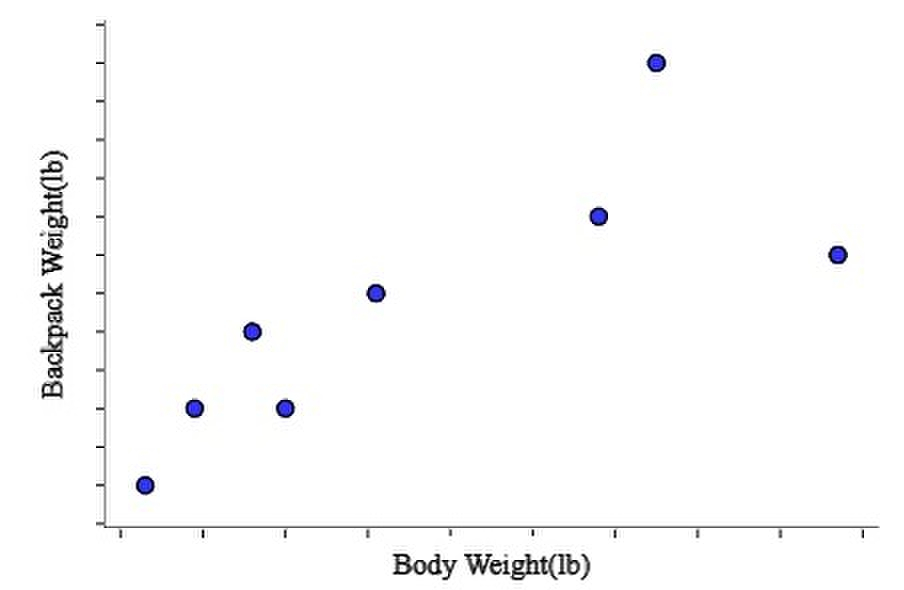
A.)
500
The mean height of married American women in their early 20s is 64.5 inches and the standard deviation in 2.5 inches. The mean height of married men the same age is 68.5 inches with standard deviation 2.7 inches. The correlation between the heights of husbands and wives is about r=0.5.
Suppose that the height of a randomly selected wife was 1 standard deviation below average. Predict the height of her husband without using the least-squares line.
The predicted value for the husband is __________ inches. (Round to 2 decimal places)
67.15
500
What is the difference between an outlier and an influential point?
A.) Outliers always influence the regression line.
B.) Influential points never affect the slope.
C.) Outliers lie far from the mean; influential points lie close to it.
D.) Outliers may not change the line much; influential points do.
E.) There is no difference.
D.) Outliers may not change the line much; influential points do.
500
The scatterplot shows the relationship between the number of people per television set and the number of people per physician for 40 countries, along with the least-squares regression line. In Ethiopia, there were 503 people per TV and 36,660 people per doctor.
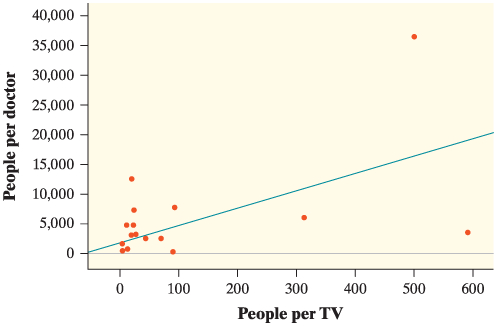
Which of the following is correct?
A.) The slope of the least-squares regression line is less than 1.
B.) The point for Ethiopia is decreasing the slope of the least-squared regression line.
C.) Increasing the number of TVs in a country will attract more doctors.
D.) Ethiopia has more people per doctor than expected, based on how many people it has per TV.
E.) The correlation is greater than 1.
D.) Ethiopia has more people per doctor than expected, based on how many people it has per TV.