General Probability
Tree Diagrams
2 step Tables
Venn Diagrams
100
Using the following spinner, what is the probability of this event happening?
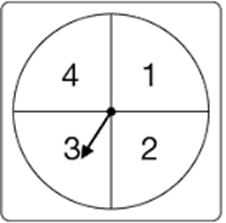
Pr(3) = 1/4
100

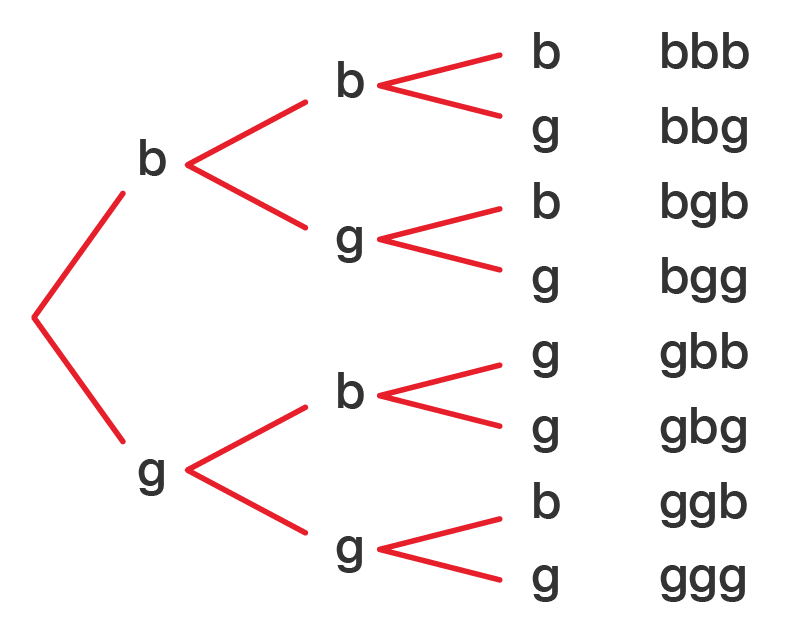
What is the probability of getting heads from 2 coin flips?
= 3/4
100
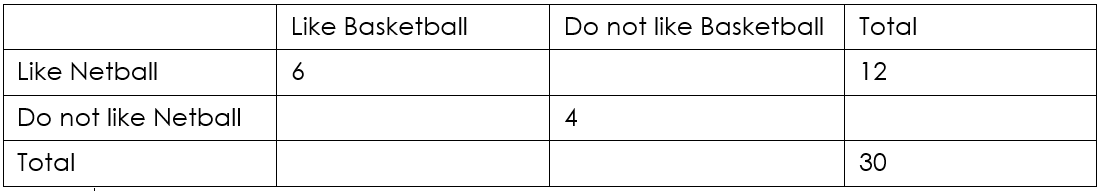
The following 2-way table shows the number of students who like and dislike basketball and netball. Complete the following 2-way table.

100
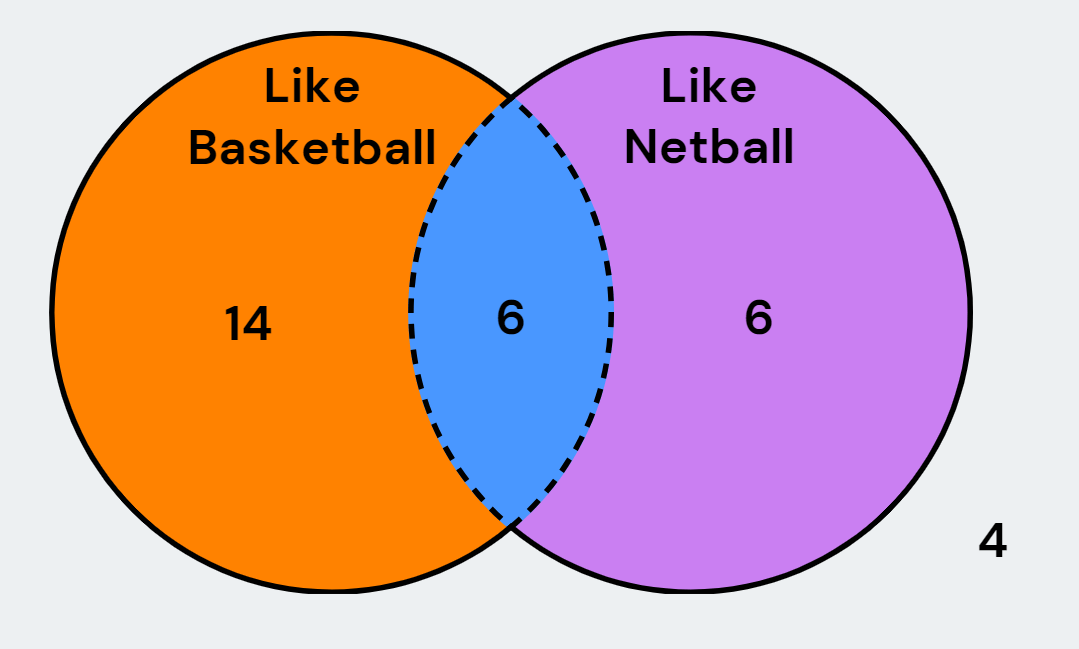
Using the above Venn Diagram, what is the probability that someone does not like both basketball and Netball?
Pr (dislike Basketball and Netball) = 4/30
200
In a survey of the school, 40 kids owned a phone. Out of the 40 kids, 15 kids did not own a phone. What is the probability that a randomly selected student from the survey owns a phone?
Pr (own phone) = 25/40 = 5/8
200
What is the probability of getting 2 of the same result
= 2/4
200
Using the below 2-way table, what is the probability that a student does not like Netball?
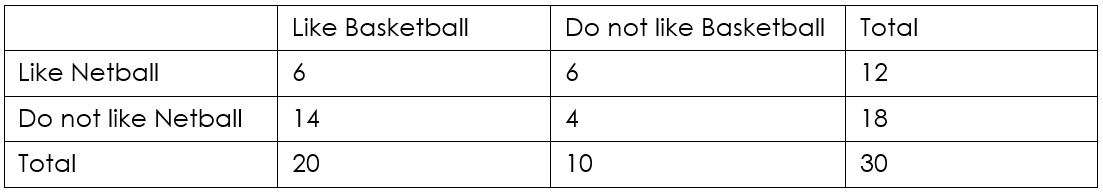
Pr (do not like netball) = 18/30
200

What is the probability that someone likes basketball?
Pr = 20/30
300
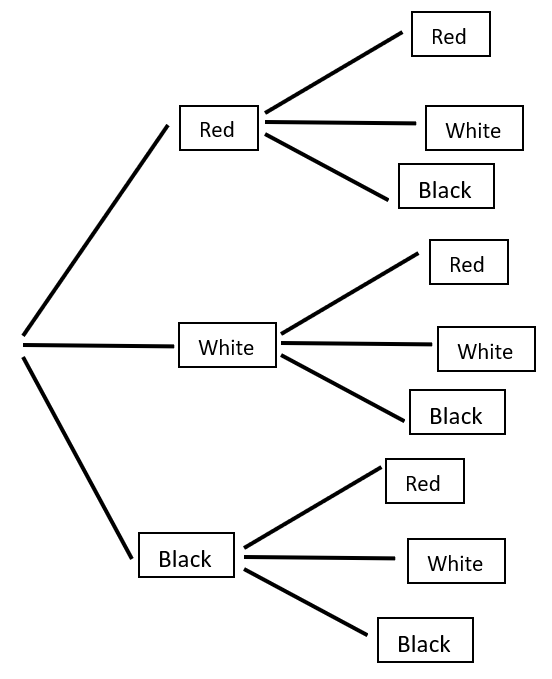
You have been selected to pick 2 colours from a bag. Inside the bag has 3 colours, Red, White and Black. After you pick a colour, you will replace the colour you select. Draw a tree diagram reflecting this 2-step experiment.
300
3 pens are chosen randomly from the colours Blue and Green. Find the probability that 1 blue pen is picked
=3/8
300
Convert the following two way table into a Venn Diagram:


300
What is the probability that someone likes a sport?
Pr=26/30
400
A group of athletes were asked if they preferred running in the heat, or training in the gym. Out of 100 athletes surveyed, 60 preferred running, whilst 40 preferred the gym.
a) What is the experimental probability of selecting someone that prefers the gym?
b) If we asked 200 athletes, how many athletes would you expect to prefer running?
a) Pr (gym) = 40/100 = 2/5
b) 120 athletes
400
Find the probability that at least 2 green pens are chosen
= 4/8 or 1/2
400

How many people like either baseball or basketball
36+31
= 67
400

How many people were surveyed?
5+6+3+15
= 29
500
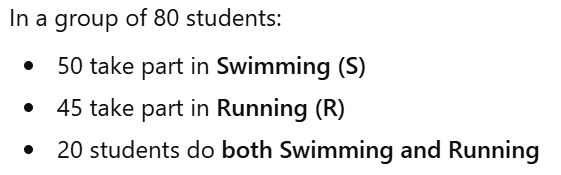
How many students dont do running or swimming?
5 Students (Show with Venn Diagram)
500
What is that probability that sam and no are picked?

= 0.6 x 0.5
= 0.3
500
Using the below 2-way table, what is the probability that a student who likes basketball, does not like netball?

Pr (likes basketball, does not like netball) = 14/20
500
How many people don't like hockey?
3+15=18