Z-scores
5 Number Summary
Outliers
Graphs
Average
100
What is the z-score of a data point that is equal to the mean?
0
100
What are the 5 numbers?
Min Q1 Median Q3 Max
100
True/False: Outliers can be found using 1.5 × IQR.
True
100
What is true about the intervals used for a histogram?
The must be equal
100
Find the median of the following set of data.
52, 84, 94, 102, 94, 89, 73
89
200
Find the z-score of 80 if the mean is 100 and the standard deviation is 10
-2
200
What does IQR stand for?
Interquartile Range
200
Data: Q1 = 10, Q3 = 20. Does 35 count as an outlier?
IQR = 10 → 1.5×IQR = 15 → Upper bound = 35
Yes
38>35
200
What kind of graph is the best to represent percentages?
Pie Graph
200
Find the mode of the following set of data.
36, 38, 38, 40, 42, 44, 40, 38, 37, 39
38
300
Find the z-score of 40 when the mean is 36 and the standard deviation is 4
1
300
Data: 4, 6, 8, 10, 12. What is Q1?
5
300
Q1 = 6, Q3 = 14. What is the upper outlier boundary?
IQR = 8 → 1.5×8 = 12 → 14 + 12 = 26.
300
What is the median of the set of data?
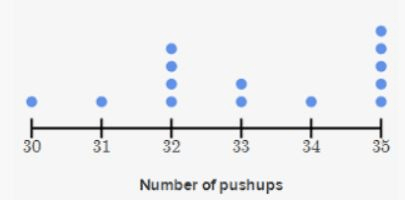
33
300
Name one of the math words that we've used to describe the normal distribution
symmetric, unimodal
400
Find the z-score of 23.4 when the mean is 20 and the standard deviation is 4.
0.85
400
Data: 3, 7, 8, 12, 13, 14. What is Q3?
13
400
A student miscalculates the median. How does this affect the IQR?
It does not directly affect IQR; IQR depends on Q1 and Q3, not Q2.
400
This graph has bars that touch, frequency on the y-axis, and intervals on the x-axis. What is the name of this graph?
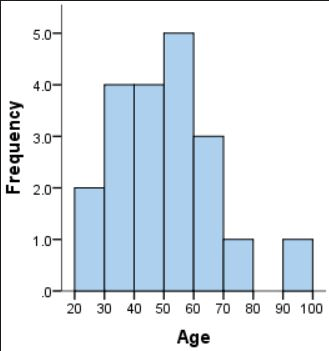
Histogram
400
The heights, in inches, of a group of two year old boys are:
35, 35.5, 32, 32.5, 38, 37, 37, 36.
Calculate the standard deviation
2.2
500
Find the z-score of -14 when the mean is 4 and the standard deviation is 20
-0.9
500
Data: 12, 15, 17, 19, 25, 30, 31. Find Q1, Q3, and IQR.
Q1 = 15
Q3 = 30
IQR = 15
500
Q1 = 12, Q3 = 18. Would the value -2 be an outlier?
IQR = 6 → 1.5×IQR = 9 → Lower bound = 12 – 9 = 3 → -2 is below 3 → Yes, outlier.
500
Make a stem and leaf plot for the following data"
34, 34, 36, 45, 41, 46, 47, 56, 51, 59, 67, 62, 62, 70, 71
________
3 | 4 4 6
4 | 1 5 6 7
5 | 1 6 9
6 | 2 2 7
7 | 0 1
5 l 6 = 56
500
The students in Hugh Logan's math class took the Scholastic Aptitude Test. Their math scores are shown below. Find the mean score. Round your answer to the nearest tenth.
647 541 340 350 491 353 356 508 470 482
453.8