Visual Vocabulary
Jira Vocabulary
Types of charts
I was born in
100
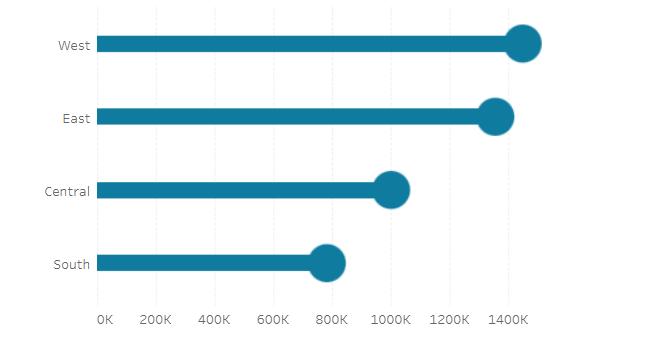
Emphasizes Variations from a fixed point
What is deviation?

100
Worked sized and put in a sprint
What is a story?
100
A type of chart or a tasty frozen treat
What is lollipop?
100
Taipei
Where was JinChong born?
200
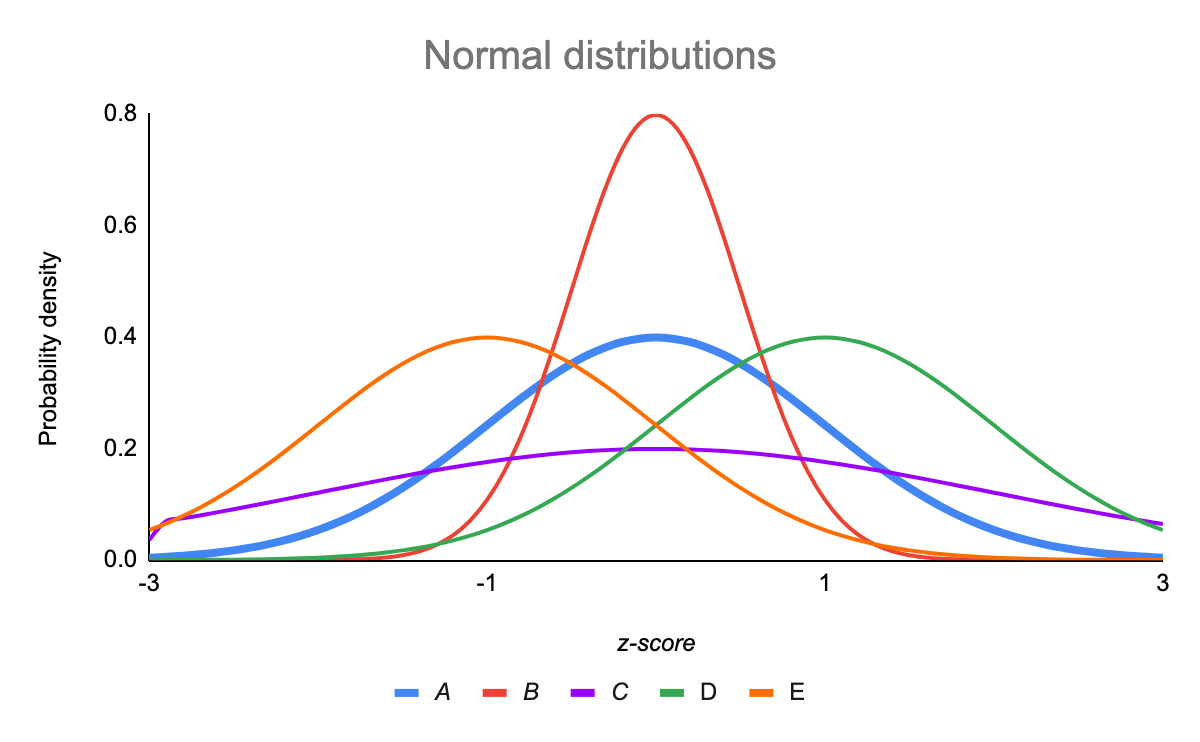
Shows values in a dataset and how often they occur
What is a distribution?
200
Parent to a story
What is an Epic?
200
Shows statistical distributions
What is a histogram?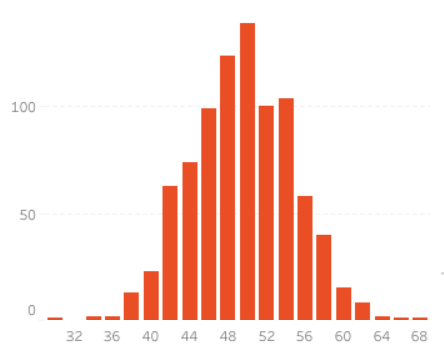
200
Fontana
Where was Loren born?
300
Shows the relationship between two or more variables
What is correlation?

300
What we call iterations in scrum
What is a sprint?
300
Summarizes multiple distributions by showing the median (center) and range of the data
What is a boxplot?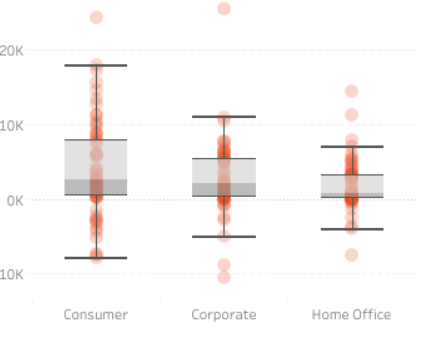
300
Chalchuapa
Where was Doug born?
400
Shows size comparisons
What is magnitude?

400
The goal of stories in a sprint is to
What is complete them in the sprint?
400
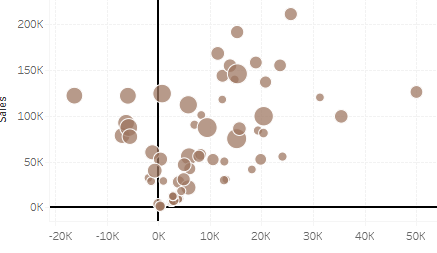
Like a scatterplot but adds detail by sizing the circles according to value.
What is a bubble chart?
400
Hong Kong
Where was Grace born?
500
Used when precise locations or geography patterns are important
What is spatial?
500
Epics should be closed
What is quarterly?
500
Grid-based data values mapped with an intensity color scale.
What is a heat map?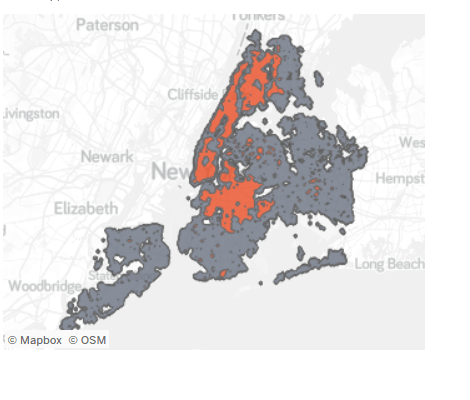
500
Chennai
Where was Tahera born?