Vocabulary
States of Matter & Phase Changes
Chemical Reactions
Chemical Reactions
Analyzing Data
100
What word describes: A type of chemical reaction in which more energy is absorbed from the surrounding.
Endothermic Reaction
100
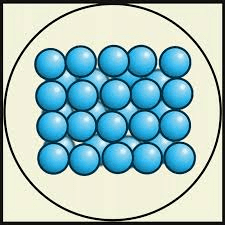
In which state of matter are particle close together but can slide past one another?
Liquid
100
What has to form in a chemical reaction?
A new substance
OR
New properties
100
What must be true about the number of atoms in a chemical reaction?
The number of atoms MUST stay the same.
100
Some chemical reactions are endothermic while others are exothermic. The amount of energy that is absorbed or released in a reaction is often measured in joules (J) or kilojoules (kJ). Data was collected on a gram of different materials during reaction and presented in the chart below.
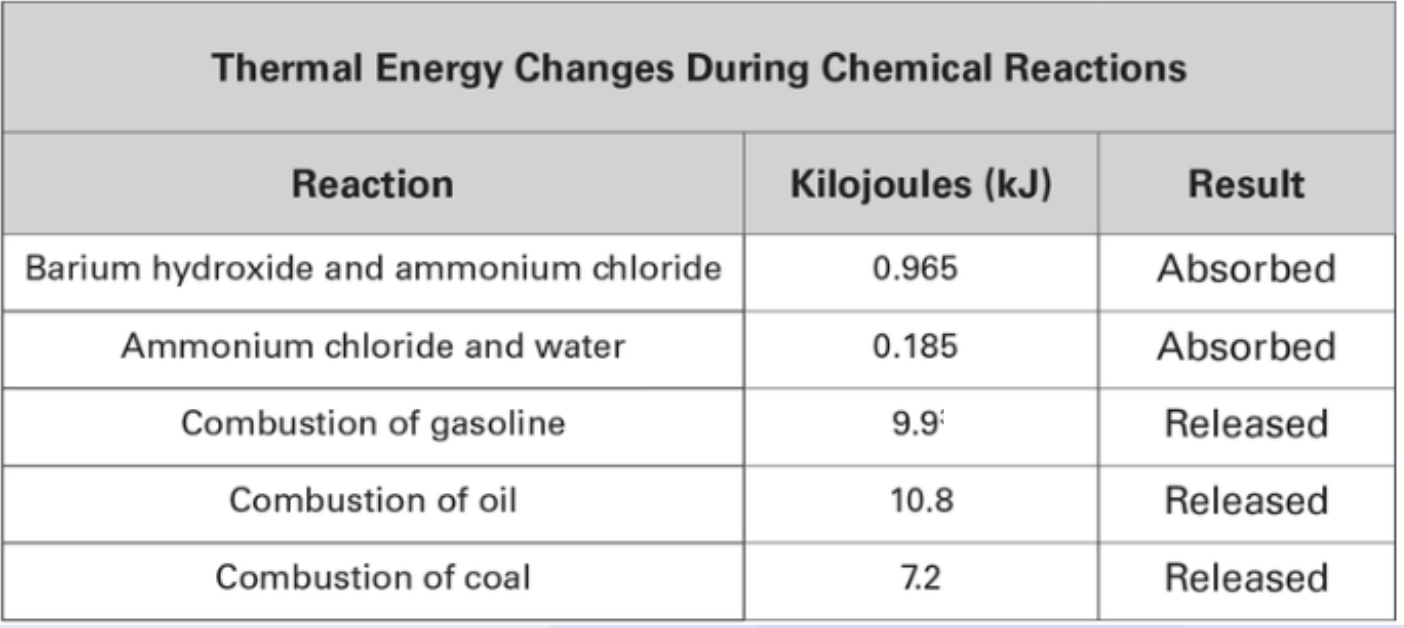
Based on the data above, which of the reactions is the most exothermic reaction?
Combustion of oil
200
What is the name of the scientific law that state: Matter cannot be created nor destroyed?
The Law of Conservation of Matter
200
Which state of matter has the least amount of kinetic energy?

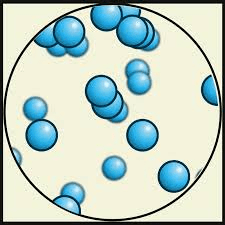
solid
200
What are signs/ indicators that a new substance has formed from a chemical reaction? List 3 signs/ indicators
- Color change
- State of matter change (bubbles/ fizz)
- Strong smell or odor
- Light/ burning
- Explosion
- Changes in: density, solubility, melting/boiling points, flammability)
200
Does the reaction follow the law of conservation of matter? How do you know?
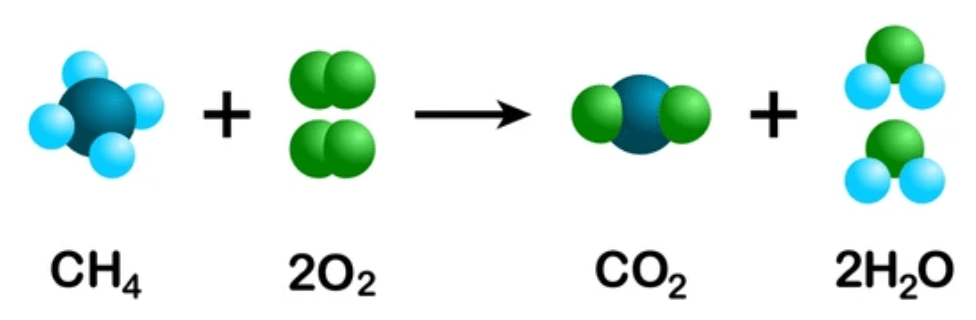
Yes, the number of atoms are equal.
200
A student noticed that the apple slices she packs for a snack turn brown before she can eat them 30 minutes later. She wanted to find the best, readily available, solution to this problem. To evaluate possible solutions, she cut an apple into six slices. She dipped each slice into a different preservative for 30 seconds each, except for one slice, which she set aside. She then placed all six apple slices on paper plates. She recorded her observations in the table below.

Did a chemical reaction take place when water was used as a preservative?
Yes (change of color after 20 minutes)
300
What word describes: the total internal energy of an object due to the motion of the particles. Hint: this depends on the total number of particle.
Thermal energy
300
What is it called to change states from a gas to a liquid?
Condensation
300
If you mix two substances together, and you observe no visible changes in properties, what are some chemical properties you could also test?
- Density
- Solubility
- Flammability
- Melting/ boiling points
300
What type of chemical reaction is cellular respiration?
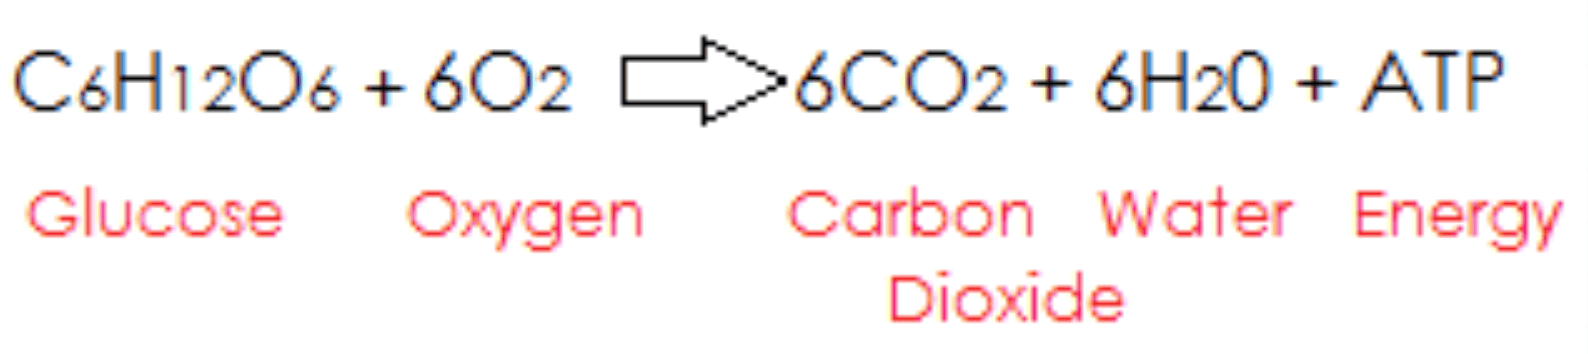
Exothermic Reaction
300
A student noticed that the apple slices she packs for a snack turn brown before she can eat them 30 minutes later. She wanted to find the best, readily available, solution to this problem. To evaluate possible solutions, she cut an apple into six slices. She dipped each slice into a different preservative for 30 seconds each, except for one slice, which she set aside. She then placed all six apple slices on paper plates. She recorded her observations in the table below.
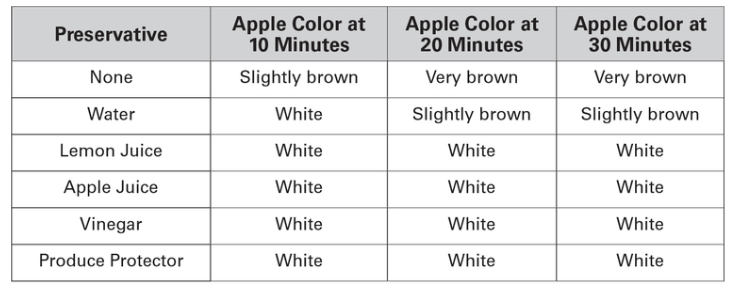
Which preservative prevented a chemical reaction from taking place?
- Lemon juice
- Apple juice
- Vinegar
- Produce Protector
400
What word describes: The measure of the average kinetic energy of the particles in an object.
Temperature
400
What is one way to get the particles from the solid state to change from a solid to a liquid?

Increase the temperature (heat it)
OR
Increase the pressure
400
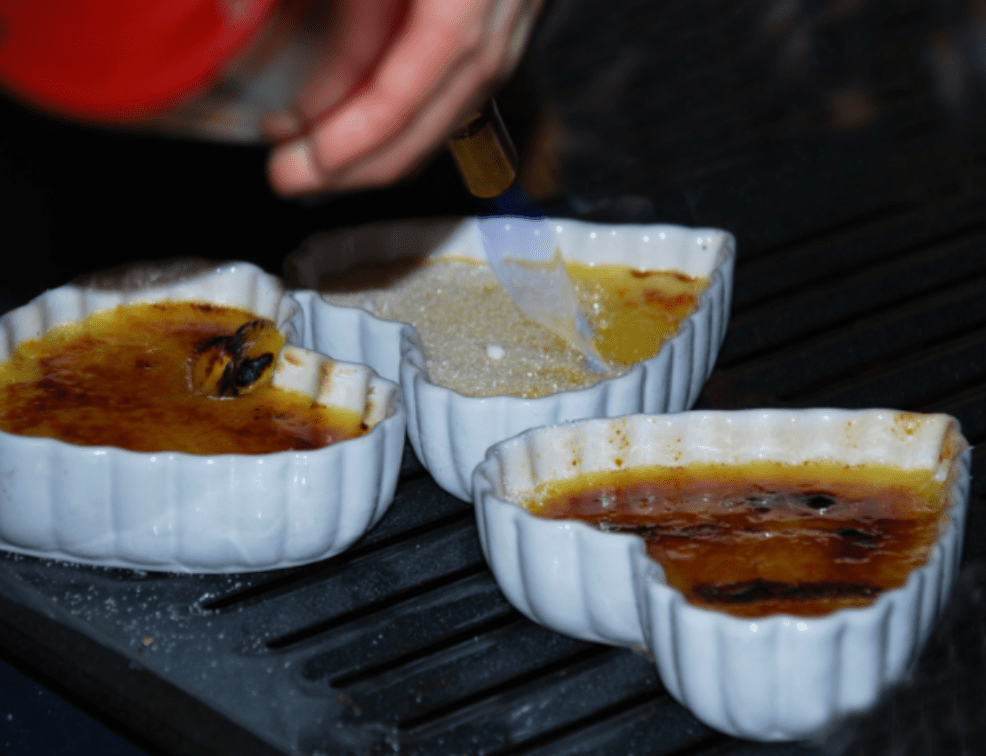
When a banana is overripe, it starts to turn brown over time. Is this a chemical or physical change?
Chemical change (change of color, taste, texture)
400
In order for sugar to burn and react with oxygen gas, heat energy must be supplied to start the reaction.
What is the minimum energy needed for atoms and molecules to break chemical bonds and form products in a chemical reaction.
Activation energy
400
The sea ice in the Arctic plays a vital role in controlling Earth’s climate. The amount of ice present in the Arctic changes with the seasons; however, some of the ice remains all year long. Changes in the amount of sea ice also affects sea levels.
A group of scientists compared average global temperatures to the trends in Arctic sea ice and global sea levels. Graph 1 shows the differences in Earth’s average temperatures over time. Graph 2 shows the changes in the amount of Arctic sea ice in the month of September each year. In this graph, “extent” refers to how much of the surface is covered by sea ice. Graph 3 shows the changes in global sea levels over time.

Compare graph #1 & #3. What correlation do you notice about Earth's global temperature and average sea levels?
As Earth's temperature increases, sea level increase
500
What word describes: the energy of motion; any object that's moving has it, and it's determined by the size of the object is and how fast it's going.
Kinetic energy
500
Mothballs slowly vaporize releasing a pesticide that kills pests like moths. What is the name of this phase change?
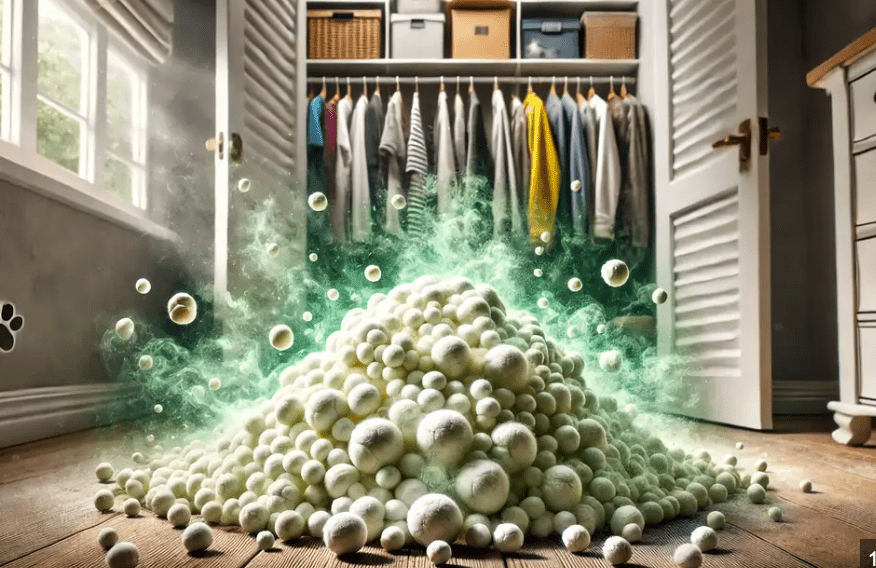
Sublimation
500
When dissolving salt in water, the salt crystals seem to disappear and turn to a liquid.
Is this a chemical or physical change?
Physical. The original substances can be filtered out (salt) and no new substance forms.
500
What is the chemical equation for the ball-and-stick model below?
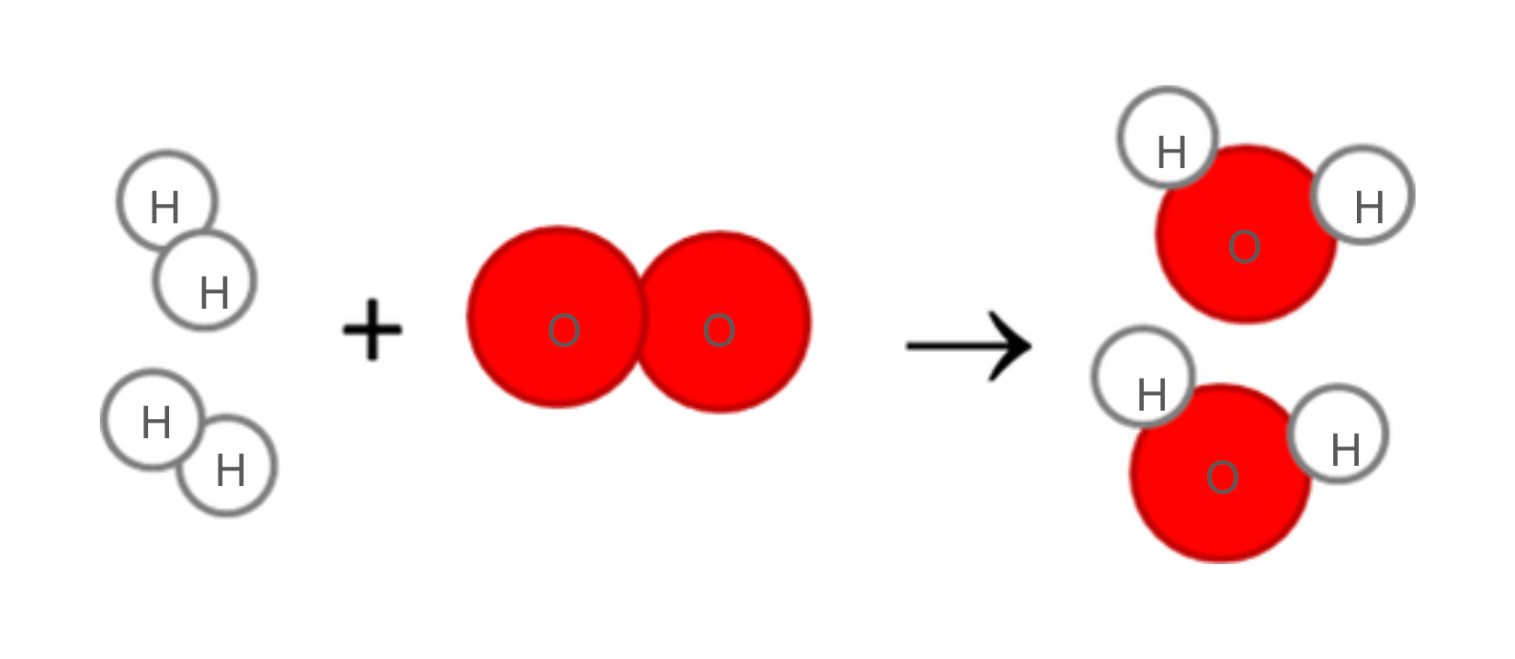
2H2 + O2 -> 2H2O
500
The sea ice in the Arctic plays a vital role in controlling Earth’s climate. The amount of ice present in the Arctic changes with the seasons; however, some of the ice remains all year long. Changes in the amount of sea ice also affects sea levels.
A group of scientists compared average global temperatures to the trends in Arctic sea ice and global sea levels. Graph 1 shows the differences in Earth’s average temperatures over time. Graph 2 shows the changes in the amount of Arctic sea ice in the month of September each year. In this graph, “extent” refers to how much of the surface is covered by sea ice. Graph 3 shows the changes in global sea levels over time.
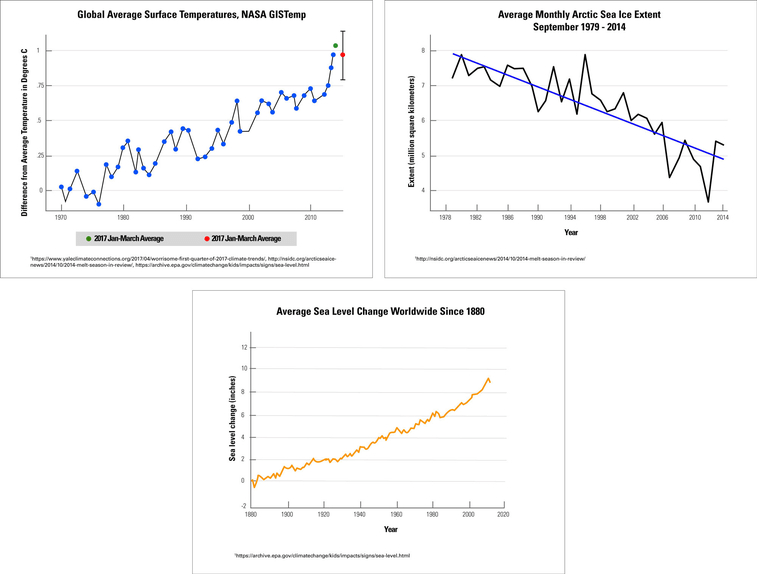
Compare all three graphs. Identify one cause and effect relationship between any of the two graphs.
1.) As Earth's average temperature increase, Arctic sea ice levels decrease.
2.) As Arctic sea ice levels decrease, global sea levels increase.
3.) As Earth's average temperature increase, global sea levels increase.