1
2
3
4
5
100
What is data?
Values along with their contex.
100
What is this kind of chart called?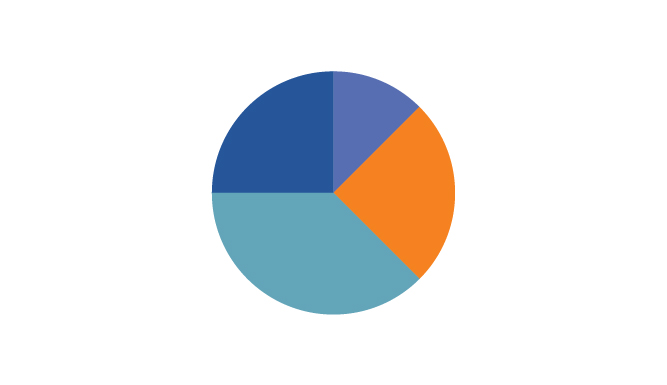
Pie chart
100
What does SOCS stand for?
Shape, outliers, center, spread
100
What must we describe for BOTH distributions when comparing distributions?
SOCS in context for BOTH sets of data/distributions and you must use comparitive language
100
Determine how many categorical and quantitative data sets you have.
Age (year), race, gender, height (ins), zip code
1. 2 Quantitative
2. 3 Categorical
200
What is the definition of statistics?
The science and art of collecting, analyzing, and drawing conclusions from data.
200
What is marginal distribution?
Compares to the entire group.
200
If the data are skewed, whats the best measure of center?
Median
200
What SHAPE is this distribution?
Bimodal
200
Below is a list of the number of days students were tardy to Lincoln High School. Create a Key for the stem- and leaf plot
ANSWERS WILL VARY.....
300
Height, weight, and race are all examples of...?
Variables.
300
What is one sign that a relative frequency table is wrong?
Doesn't add up to 100
300
Describe a graph that is skewed right.
The center is closer to the lower values in the data set with one or a couple outliers far to the right.
300
Why should we use a back to back stem and leaf plot?
Because it allows us to easily see and compare distributions.
300
 What does the dot above 15 represent?
One member of the running club rand 15 Kilometers
400
Is the length of hair in cm categorical or quantitative?
Quanatative.
400
What type of table helps us see how one variable is related to another?
Two way tables
400
Why do we split stems in a stem and leaf plot?
To see the shape of the distribution better
400
Describe the distribution.
S: Skewed Right
O: No Outlier
C: Median = 24 Birds
Spread: 54 Birds
400
When comparing distributions what is one thing students ALWAYS forget to do?

Use comparative language!!!!
500
What type of Varibales are there?
Quantiative and Categorical
500
What are the two types of quantitative data?
Discrete and Continuous
500
What is true about the relationship between the mean and median if the data is roughly symmetric?
mean = meadian
500
What do you think is grater the mean or the media & Why?
The mean is less than the median, the data is skewed left
500
If you want to reorder the list of numbers in your desmos calcualtor from least to greatest what functions do you need?
A= [ #,#,#,#,#,#]
sort(A)
**Note Sort needs to be all lowercase letters