Regression Equations
Function Type
Residuals
Exp. & Compound Interest
Mystery
100
A local coffee shop owner is tracking their weekly sales and the number of cups of coffee sold. The data is as follows: (Week 1, $2,450, 480 cups), (Week 3, $2,900, 560 cups), (Week 5, $3,350, 650 cups), (Week 7, $3,700, 720 cups). Create a linear regression equation that models the relationship between weekly sales (y) and the number of cups of coffee sold (x). 💰
y=5.186x-24.753
100
A table of values for a function is shown below.
| x | 1 | 2 | 3 | 4 | 5 |
| y | 5 | 8 | 11 | 14 | 17 |
Which type of function is best represented by this table and why?
Linear, constant change in y values
100
A student collected data on the number of hours they studied for a math test (x) and their score on the test (y). They created a linear regression model and found the equation to be y^=8x+65. If a student studied for 3.5 hours and scored an 88 on the test, what is the residual for this data point?
-5 (scored less than predicted)
100
You invest $5,000 in an account that pays 4.5% annual interest compounded quarterly. How much money will be in the account after 10 years?
$7,810.05
100
How do you solve for a specific x-value on your calculator?
Graph it, 2nd trace, "value" OR plug into equation.
200
How can you store a regression equation in your calculator?
As you are computing regression equation, "ALPHA" "Trace" "y1" OR "VARS" "Y-VARS" "Function" "y1".
200
The population of a small town is decreasing by a constant percentage each year. What type of function would best model the town's population over time?
Exponential, "decreasing by a constant percentage each year".
200
A linear regression model is created to predict the height of a plant over time. The residual plot for this model shows a clear U-shaped curve, with residuals that are positive for low and high values of time and negative in the middle. What does this residual plot indicate?
The linear model is not an appropriate fit for the data, and a quadratic or exponential model would likely be a better choice.
200
A new car is purchased for $25,000. Its value depreciates at a rate of 15% per year. Which equation models the car's value V after t years?
V=25000(0.85)t
200
What is something you can use to describe a model's appropriateness to model a data set?
Residuals.
300
A scientist is observing a bacterial colony in a petri dish. They record the number of bacteria every hour. The data is: (Hour 0, 100 bacteria), (Hour 2, 400 bacteria), (Hour 4, 1,600 bacteria), (Hour 6, 6,400 bacteria). Create an exponential regression equation to model the growth of the bacteria. Using the equation, what is the predicted number of bacteria after 10 hours? 🦠
102,400 bacteria
300
Create a table of values that would represent an exponential function.
Answers may vary. Y values should have a common growth or decay factor.
300
Construct a residual plot that would mean the model is a GOOD fit for the data.
No pattern.
300
Given the function, what do the parameters represent?
y=100(1.0245)^x
100 represents initial value and 1.0245 represents growth factor of 2.45%
300
If your calculator says "syntax error", this could mean you accidentally typed "blank" instead of "blank".
"minus" "negative"
400
A company launches a new product and tracks its profit over the first several months. The data shows profit in thousands of dollars: (Month 1, $15), (Month 2, $28), (Month 3, $39), (Month 4, $48), (Month 5, $55). The profit seems to increase and then level off. Use quadratic regression to model the relationship between profit (y) and the number of months (x). According to your model, in which month will the profit be at its maximum? 📈
Month 8 (profit would be $64)
400
A table of values for a function is shown below.
| x | -2 | -1 | 0 | 1 | 2|
| y | 7 | 2 | -1 | -2 | -1 |
Which type of function is best represented by this table?
Quadratic, 2nd differences are the same (1st differences are linear).
400
What is an ideal residual value?
Zero
400
A biologist is studying a population of bacteria that doubles every 15 minutes. If the initial population is 100 bacteria, which equation represents the population P after t hours?
P=100(2)4t
400
Give an example of a time where you would not be able to compute second differences when given a table of values.
When the x-values change inconsistently.
500
A farmer is tracking the growth of a new variety of corn. The height of the corn stalk in inches is measured over 8 weeks: (Week 1, 10), (Week 2, 19), (Week 3, 27), (Week 4, 34), (Week 5, 40), (Week 6, 45), (Week 7, 49), (Week 8, 52). Which type of regression—linear, quadratic, or exponential—would best fit this data? Justify your choice by creating all three equations and explaining which one is the most appropriate model for the data. 🌽
Quadratic Function (Correlation coefficient is perfect =1 and all the residuals are 0).
500
Create a contextual example of a Quadratic Function.
Answers may vary.
500
Which, if any, of the following residual plots show that the model is a good fit for the data and why?
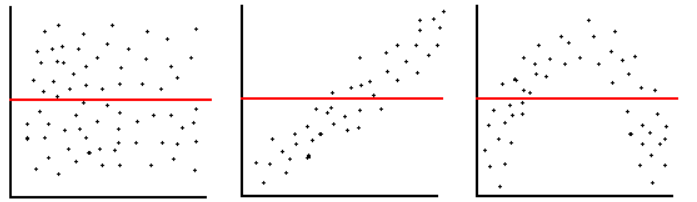
The 1st one because there is no clear pattern.
500
How long will it take for an investment of $2,000 to grow to $5,000 in an account with an annual interest rate of 8% compounded monthly?
Approximately 11.49 years
500
How do you solve for an x-value given a specific y-value on your calculator?
Graph the equation in y1 and graph the y-value in y2, 2nd trace, "intersect".