1.6 Measuring Center
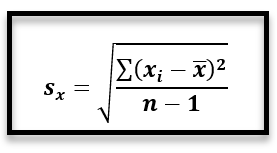
1.7 Measuring Variability
1.8 Boxplots and Outliers
1.9 Cumulative Relative Frequency
1.9 Z-Score & Percentile
100
The median of the data
12, 21, 26, 28, 30
What is
26
100
What are the three ways we can measure variability?
How do we calculate each one?
Range, IQR, Standard Deviation
Max-Min
Q1-Q3
100
The five numbers needed to create a boxplot.
Minimum
100
Define cumulative relative frequency.
the sum of relative frequencies for a given value and all previous values in an ordered dataset
100
Terry’s boss told him that he did not deserve a raise and that Terry was making an amount similar to other managers with his experience. Terry gathered some data and found that the z-score for his salary as compared to other managers with the same level of experience is -1.35.
Interpret Terry's Z-Score.
Terry salary is 1.35 standard deviations below the mean salary of all managers with his experience level.
200
The median of the following data
24, 20, 15, 14, 12, 23
What is
17.5
200
Find the range of the data
12, 340, 2, 40, 5
338
200
Evaluate the IQR for the following boxplot
80-25=
55
200
The following table shows the amount of time spent by students on a electronic device .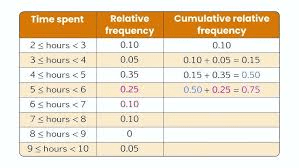
Using the relative frequency, evaluate the cumulative relative frequency for the rest of the data.
.85 => 85%
.95 => 95%
.95 => 95 %
1 => 100%
200
Below are 11 students final grade in a marking period.
65, 70, 75, 78, 82, 85, 88, 90, 91, 92, 95
Evaluate the percentile of Mark who scored a 85.
Mark was in the 45th percentile.
300
The mean of the data
31, 24, 25, 9, 2
What is
18.2
300
The five-number summary of the distribution of scores on the final exam in Honors Statistics last
semester was Min =18 Q1 = 39 Med = 62 Q3 = 76
Max = 100. A total of 416 students took the
exam.
Evaluate the IQR.
IQR=37
300
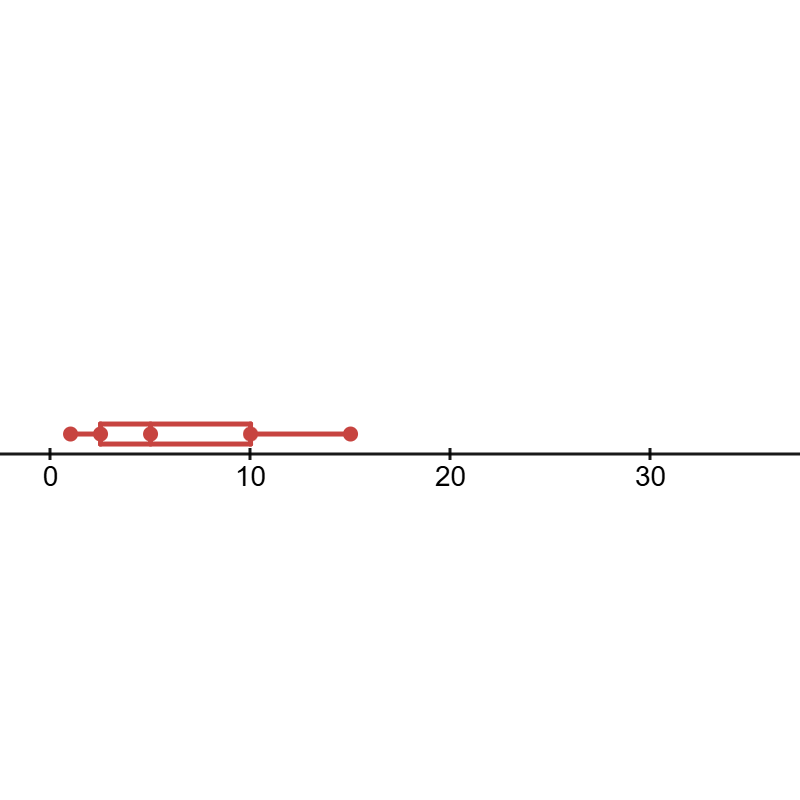
Draw a Boxplot for the following data.
1, 2, 3, 5, 8, 12, 15
300
Below is a cumulative relative frequency graph for the lengths, in minutes, of 200 songs recorded by the Rolling Stones.
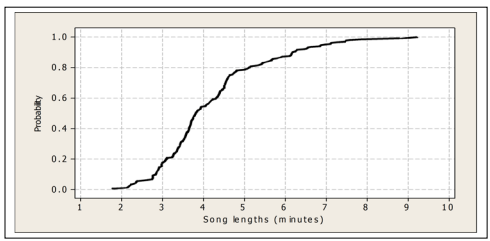
Approximately what percent of the song lengths will last more than 5 minutes?
About 20% of songs will last more than 5 minutes.
300
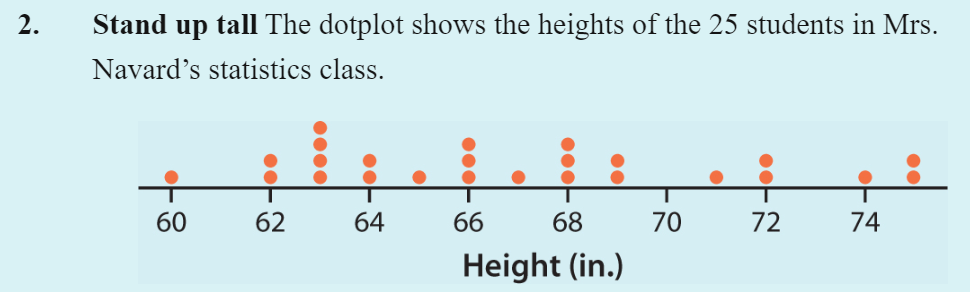
Find the percentile for Lynette, the student who is 65in tall.
She is in the 36th percentile.
9/25=.36
400
The measurement of center used for this graph.

What is
Median
400
Below are Faith’s 13 quiz grades in a marking period.
83 94 78 80 91 83 86 86 96 74 80 84 20
Evaluate the IQR for her quiz grades.
88.5-79
=9.5
400
Two cars A and B are racing. The distribution of their speeds at 5 second intervals are represented by the box plots. 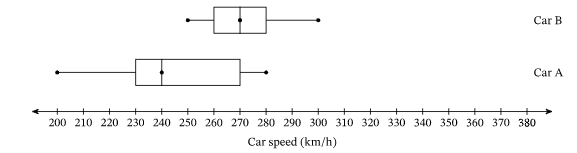
Compare their variability and center of both cars.
Car B has a larger variability IQR and Range.
Range of car B is 50, while the range of car A is 80. The IQR of car B is 20, while the IQR of Car A is 40.
The center (median) of car A is 240. The median of car B is 270.
400
Below is a cumulative relative frequency graph for the lengths, in minutes, of 200 songs recorded by the Rolling Stones.
What is the percentile for a song lasting 3 minutes? Interpret this value in context.
Around the 16th percentile.
16 percent of songs last less than 13 minutes.
400
A group of 78 third-grade students in a Midwestern elementary school took a “self-concept” test that measured how well they felt about themselves. Higher scores indicate more positive self-concepts.
A histogram and some summary statistics for these students’ self-concept scores are given below.
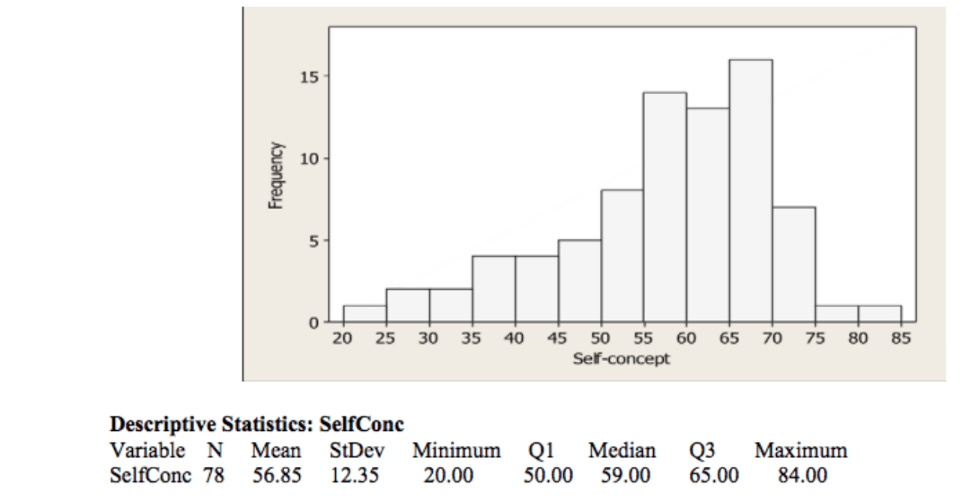
One student in the group had a self-concept score of 62. Calculate and interpret this student’s z-score.
(62-59)/(12.35)= .24
The students score is .24 standard deviations above the Mean.
500
How many runs does the Lawrence High School baseball team usually score? Here is a dot plot on the number of runs scored by the team in all 21 games played during a recent season.
Evaluate and interpret the mean and median for the following data.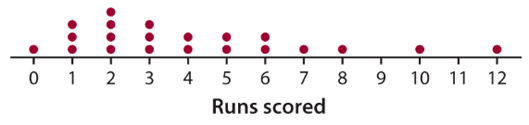
Mean: On average 4.14 runs were scored.
Median: Half the games they scored more than 3 runs, half the games they scored less than 3 runs.
500
What does standard deviation measure?
Average distance the data is from the mean.
500
Below are Faith’s 13 quiz grades in a marking period.
83 94 78 80 91 83 86 86 96 74 80 84 20
Are there any outliers in the data? If so how did you use the 1.5 x IQR to prove it?
Yes 20 is an outlier.
Anything below 64.75 is an outlier, and anything above 102.75 is an outlier
500
Below is a cumulative relative frequency graph for the lengths, in minutes, of 200 songs recorded by the Rolling Stones.
What song length would be considered to be at the 20th percentile?
About 3.1 minutes in song length will be the 20th percentile
500
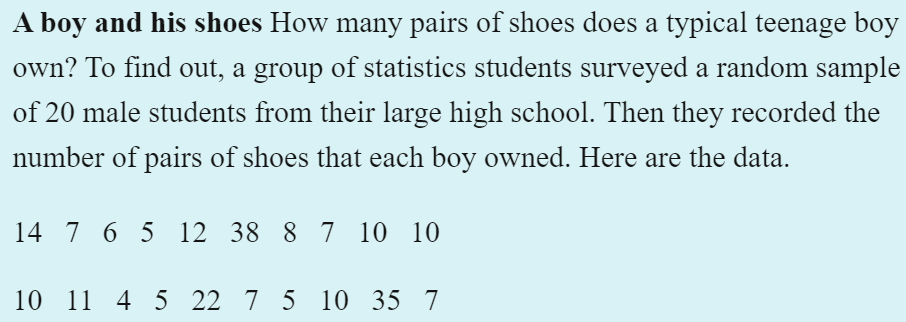
Luis is at the 20th percentile of the distribution. How many pairs of shoes does Luis own?
4, 5, 5, 5, 6, 7, 7, 7, 7, 8, 10, 10, 10, 10, 11, 12, 14, 22, 35, 38
(.20)(20)=4
4 people own less shoes then Luis, therefore he owns 6.