Define words
Give examples: Team with the most wins
Graphs
Immigration
Fun with maps
100
Over population
more people in an area then can be supported by the resources of that area
100
Push factors
100
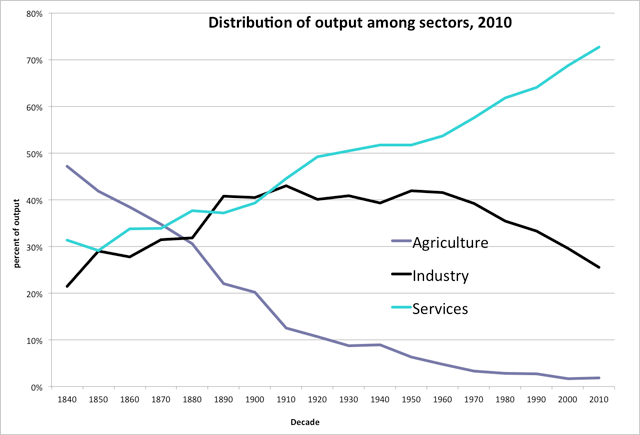
Line graph: shows trends over time, compares trends
100
Why do asylum seekers leave their countries?
Usually political repression or individual threats from crime.
100
First team to find the country Benin
200
Under Population
Not enough people to fully exploit the resources of an area.
200
Pull factors
200
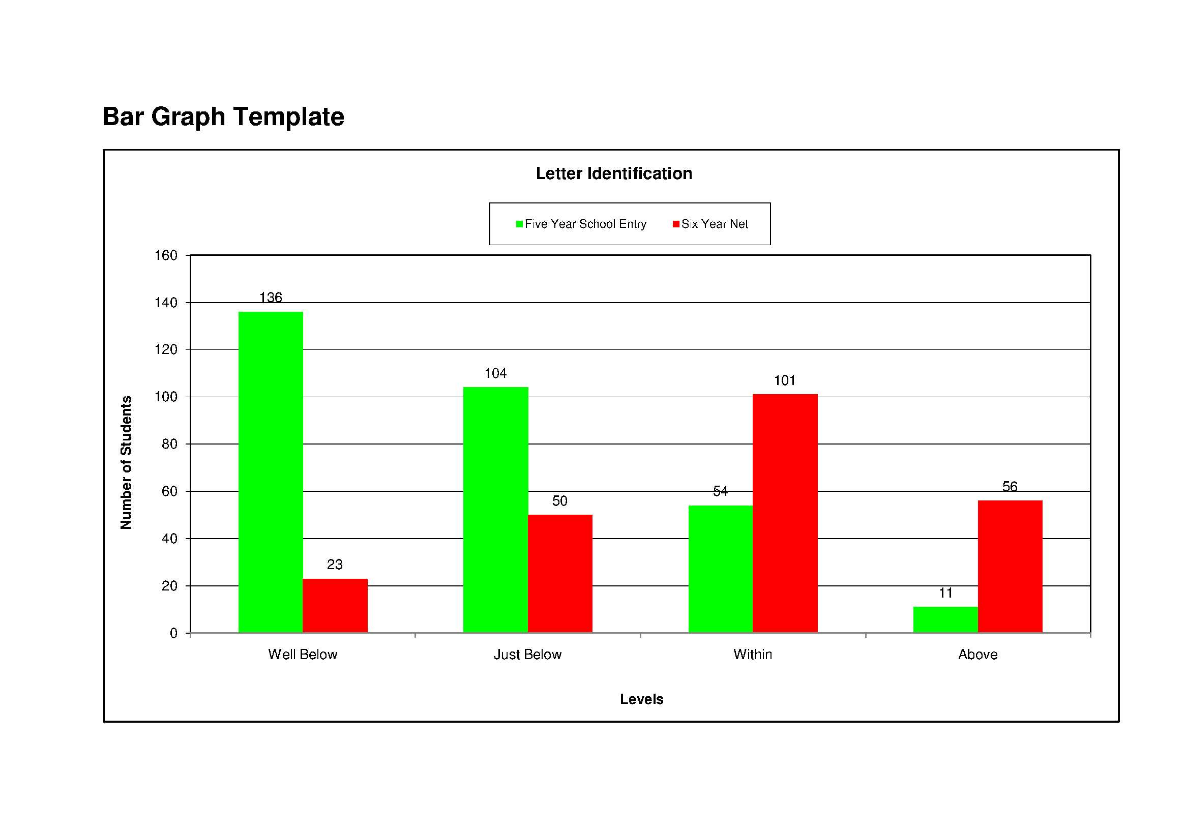
for comparing values
200
Why do some countries try to keep immigrants out?
Job competition, culture, fear, racism.
200
First team to find the Caspian Sea win the point
300
Refugee
Someone fleeing from their country without permission. usually running from war.
300
Obstacles
300
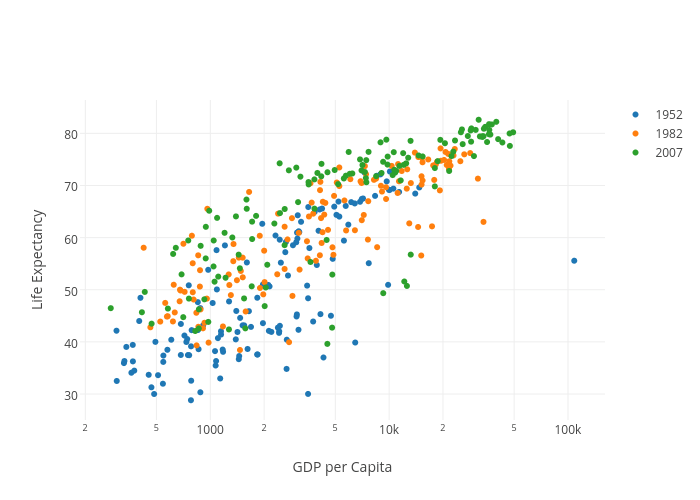
scatter plot: used to make two measures on the same thing
300
What impact does immigration have on immigrants? How do their lives change?
scary times, but usually better jobs more financial security and valuable experiences.
300
First team to find the City of Istanbul gets the point
400
Economic Migrant
Someone who goes to another country to find a job
400
kinds of graphs
scatter plot
line graph
cloropleth map
bar chart
Population pyramid
...
400
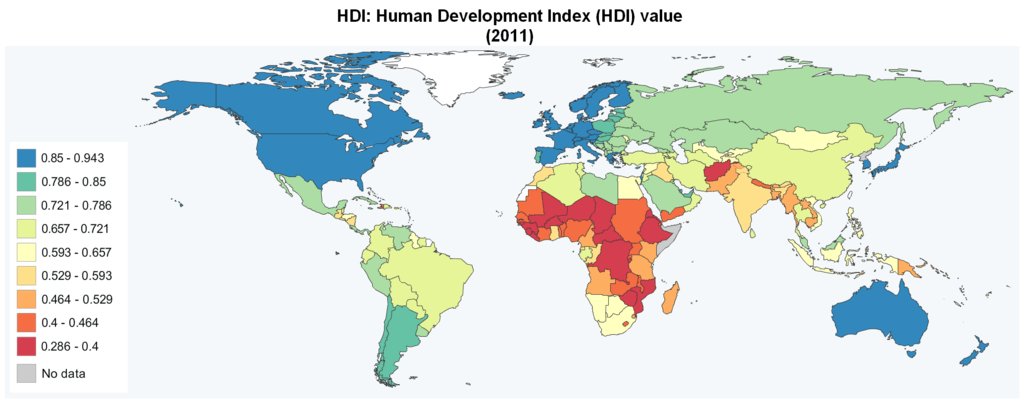
Cloropleth Map: Shaded regions indicate how values change over space.
400
What are the impacts of immigration on the countries immigrants go to?
Cheap labor, diversified culture, possible spike in crime, etc.
400
First team to find Kaliningrad gets the point
500
Illegal immigrant
Someone who goes to another country to find work without permission.
500
MEDC
500
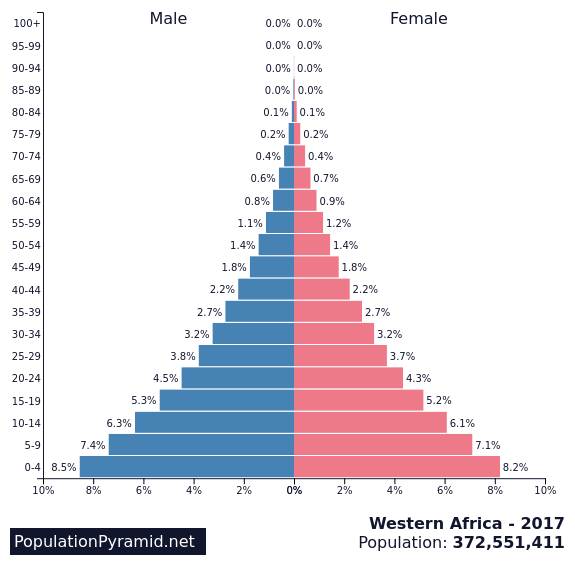
population pyramid: used to show the age and sex of a population
500
What are the impacts of migration of the countries that people leave?
Loss of young labor, loss of highly intelligent labor, less job competition, loss of taxable revenue.
500
The team that finds the map that best shows MIC gets the point.