Data Classification
Sampling Techniques
Frequency
Cumulative Frequency
100
What are the keywords that describe
Qualitative Data:
Quantitative Data:
Qualitative Data: Labels or Non-numerical Entries
Quantitative Data: Numerical Measurements or Counts
100
Randomly selecting people walking out of humanities to interview is an example of what technique?
Random Sampling
100
Range =
Max- Min
100
What is Cumulative frequency?
The Sublimation of all the frequency and is equal to the sample size
200
Discrete variables are whole numbers, so what are examples of continuous variables?
(decimals) GPA, Height, Weight etc.
200
Name the technique:
(The Easiest Method) where every 6th person is chosen to be tested in an experimentSystematic Sampling
200
How do you find the class width?
Range / # of classes
200
When bars don't touch you must create what?
What do you add and subtract from them?
*Hint - Begins with class*
Class Boundaries & .5
300
What is the science of collecting, analyzing and interpreting data in order to make a decision?
Statistics
300
Name the technique:
Kayla is asking everyone around her there age to get average data for her project.Convenience sampling
300
There are 44 data entries
Max= 200
Min= 112
Find the class width....
2
300
What does the mean equal?
Sum of all the data/ # of data
400
The height of all the students in a math class is a Population or a Sample?
Sample
400
Name the technique:
Members of a population are divided into strata and then a sample is taken for that.
Stratified sampling
400
The midpoint of a class equals?
Lower Limit= 158
Upper Limit= 192
Lowest class limit + Upper class limit / 2
175
400
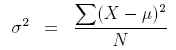
Find the variance: 4 5 3 4 8
Mean = 4 + 5 + 3 + 4 + 85 = 245 = 4.8
(4 − 4.8)^2 ......Ect then you have the sum..
FINAL ANSWER 14.85/5 = 2.96
500
List all of the "Level Of Measurements" and give one example.
Nominal(ABC), Ordinal(Military Rank) , Interval(Temperature), Ratio( Income)
500
Name the technique:
A population is divided into groups then a full region is selected to sample.
Cluster Sampling
500
Relative Frequency is equal to?
F/N or Class Frequency/Sample size
500
Find the standard deviation:
You grow 20 crystals from a solution and measure the length of each crystal in millimeters. Here is your data:
9, 2, 5, 4, 12, 7, 8, 11, 9, 3, 7, 4, 12, 5, 4, 10, 9, 6, 9, 4
3.061
#1.Mean (9+2+5+4+12+7+8+11+9+3+7+4+12+5+4+10+9+6+9+4) / 20 = 140/20 = 7
#2 Subtract the mean from each data point
(9 - 7)2 = (2)2 = 4
(2 - 7)2 = (-5)2 = 25
(5 - 7)2 = (-2)2 = 4
(4 - 7)2 = (-3)2 = 9
(12 - 7)2 = (5)2 = 25
(7 - 7)2 = (0)2 = 0
(8 - 7)2 = (1)2 = 1
(11 - 7)2 = (4)22 = 16
(9 - 7)2 = (2)2 = 4
(3 - 7)2 = (-4)22 = 16
(7 - 7)2 = (0)2 = 0
(4 - 7)2 = (-3)2 = 9
(12 - 7)2 = (5)2 = 25
(5 - 7)2 = (-2)2 = 4
(4 - 7)2 = (-3)2 = 9
(10 - 7)2 = (3)2 = 9
(9 - 7)2 = (2)2 = 4
(6 - 7)2 = (-1)2 = 1
(9 - 7)2 = (2)2 = 4
(4 - 7)2 = (-3)22 = 9
#3 Calculate the mean of the squared differences.(4+25+4+9+25+0+1+16+4+16+0+9+25+4+9+9+4+1+4+9) / 19 = 178/19 = 9.368
#4 Then fidn the square root