Slope and Unit Rate
y = mx + b
Scatter Plots
Functions and Multistep
Systems of Equations
100
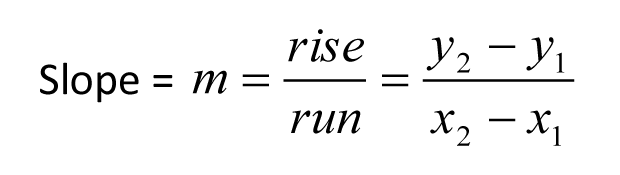
Find the simplified slope of the graph.
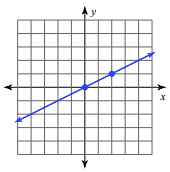
1/2
QUESTION 1

100
Write the equation of a line with a slope of -1 and a y-intercept of -3.
y = -x - 3
QUESTION 6
Beware: + -, slope of 1, intercept of 0, slope of 0
100
Which graph shows the correct Line of Best Fit?
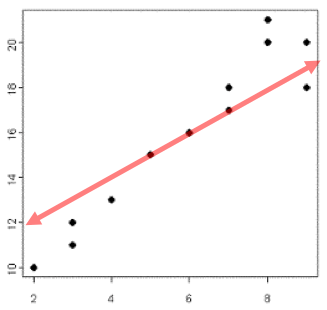
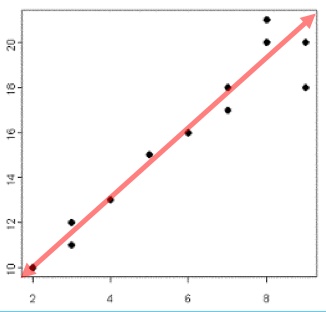
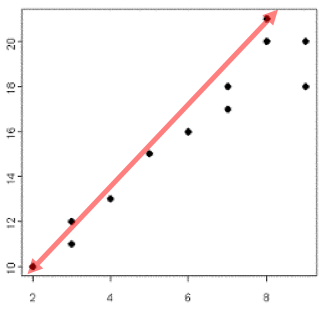
#2
QUESTION 9
A line of best fit should split the points evenly and follow the trend.
100
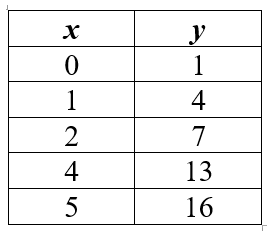
Is the following table a function? Why or why not?
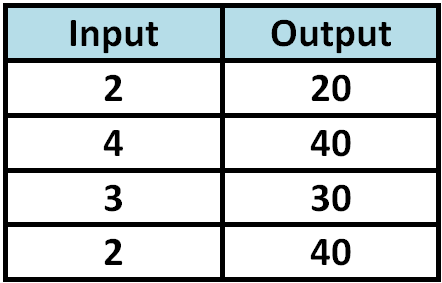
No, the input of 2 has two different outputs.
Question 13
A function is a relation in which each input has only one output.
100
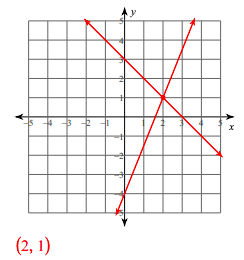
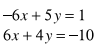
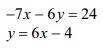
Solve by graphing.

QUESTION 16
Get both equations in slope-intercept form. Graph them, and locate their intersection.
200
Find the simplified slope between (-8, 12) and (1, 15).
1/3
QUESTION 2
200
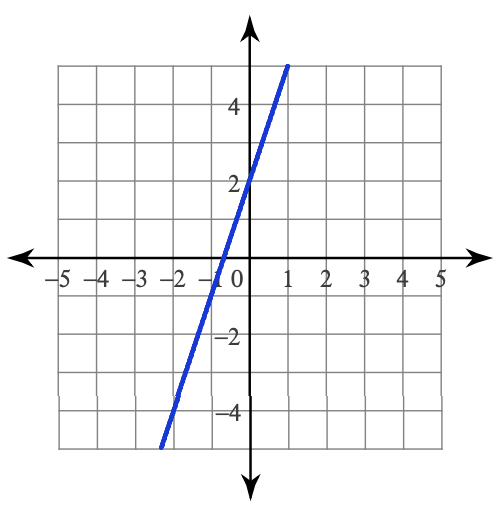
Write the equation of the graph.
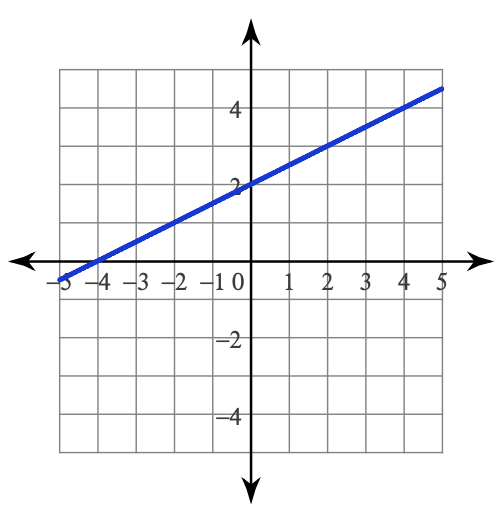
y = 1/2x + 2
QUESTION 5
y = mx + b
m - slope
b - y-intercept
200
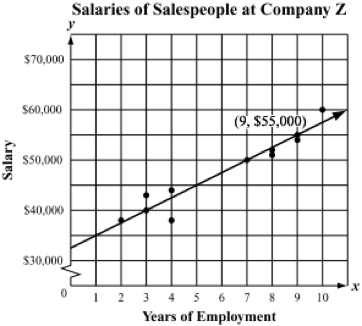 The scatterplot has a line of best fit that follows y = 2500x + 32,500. Predict the salary of someone employed for 15 years.
$70,000
QUESTION 10
Plug the given value in for the correct variable and solve.
200
What is the range of the following ordered pairs?
(5, -1) (0, 10) (5, 6) (-2, 2)
-1, 10, 6, 2
Question 12
Domain are the "inputs" or x-values.
Range are the "outputs" or y-values.
200
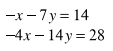
Solve using elimination.
(-1, -1)
QUESTION 18
Multiply (if necessary) to create two equal-but-opposite coefficients.
Add your equations and solve for one variable.
Plug the solution into any equation and finish solving.
300
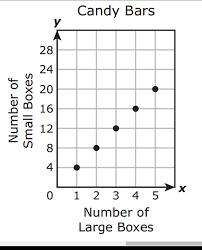
Find the simplified slope of the table.
3
QUESTION 3
300
Graph the equation y = 3x + 2.
QUESTION 8
Begin with the y-intercept. Use the slope to count up/over or down/over from there. Include arrows!
300
The scatterplot has a line of best fit that follows y = 2500x + 32,500. How long would it take for someone to make $100,000?
27 years
QUESTION 10
Plug the given value in for the correct variable and solve.
300
What is the domain of the following graph?
1, 2, 3, 4, 5
Question 12
Domain are the "inputs" or x-values.
Range are the "outputs" or y-values.
300
Solve using elimination.
(0, -2)
QUESTION 16
Multiply (if necessary) to create two equal-but-opposite coefficients.
Add your equations and solve for one variable.
Plug the solution into any equation and finish solving.
400
Find the unit rate of the graph, including the label.
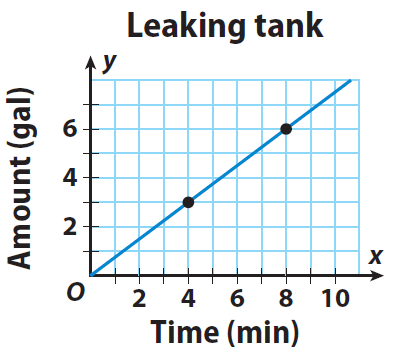
0.75 gal/min
QUESTION 4
Find slope and divide. The label is y/x.
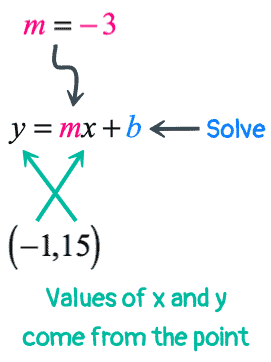
400
Find the equation of the line with a slope of -3 that goes through the point (-1, 15).
y = -3x + 12
QUESTION 7
400
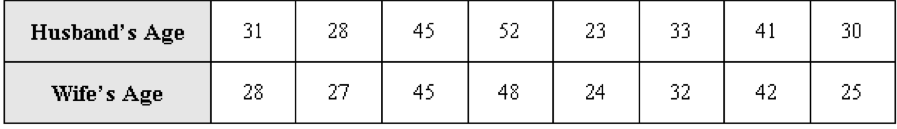
Determine the linear regression equation for the data. Round all values to the nearest tenth.
y = x - 0.2
QUESTION 11
In your calculator, go to STAT > EDIT and enter your x- and y-values. Then go to STAT > CALC and select 4:LinReg to get your slope and y-intercept values.
400
Solve for x.
2 + 3(x - 4) = 5x
x = -5
Question 15
1. Distribute parentheses
2. Get your x's in Texas
3. Solve
400
Solve using substitution.
(0, -4)
QUESTION 17
Isolate a variable.
Substitute it in to the other equation.
Solve, and substitute back into the rewritten equation.
500
Find the unit rate of the graph. LABEL.

40 mi/h
Question 4
Find the slope and divide.
500
Find the equation of a line with a slope of 2/3 and goes through the point (-9, 1).
y = 2/3x + 7
QUESTION 7

500

What is the correlation coefficient of the data? What does this value mean?
0.9, there is a strong, positive correlation
QUESTION 11
R values range from -1 (a perfect negative correlation) to 1 (a perfect positive correlation). Decimals close to these numbers show a strong correlation; decimals close to 0 show weak or no correlation.
500
Solve for x.
-4(x + 1) = 5x + 1 - 9x
no solution
Question 15
When the x's both cancel, look at the remaining numbers: if both equal - INFINITE SOLUTIONS, if not equal - NO SOLUTION
500
Solve using substitution.

(4, 4)
QUESTION 17
Isolate a variable.
Substitute it in to the other equation.
Solve, and substitute back into the rewritten equation.