Measures of Center
Measures of Spread
Modeling with Data Displays
Interpreting Data Displays
Shapes of Distributions
100
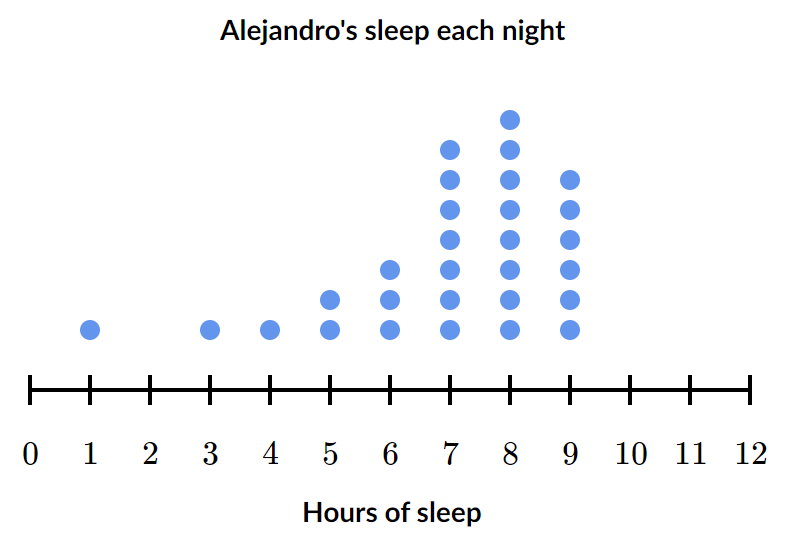
The dot plot below shows how many chocolate chips were in each cookie Emilia took to work.
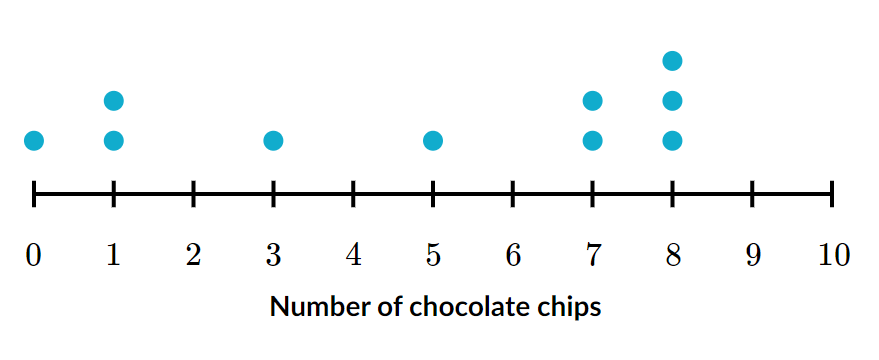
Find the median number of chocolate chips.
What are 6 chocolate chips?
100
The statistic found by subtracting the maximum by the minimum.
What is the range?
100
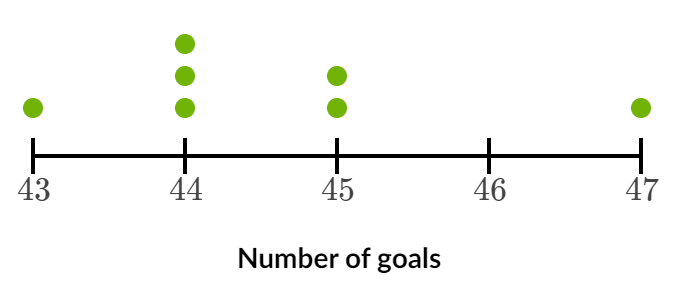
The dot plot that represents the data below:
45,43,45,44,44,44,47
(The data points represent how many goals Hank scored each lacrosse season)
What is
100
The lowest number of players at a table: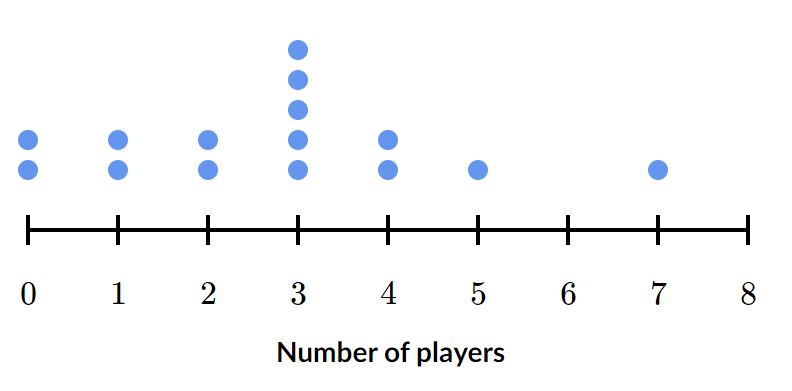
(The dot plot shows the number of players at each table in Bill's Bingo Hall. Each dot represents a different table.)
What are 0 players?
100
The shape of the distribution shown below:
What is (approximately) symmetrical?
200
The following data points represent the number of hours each of the staff members at Daniel's Department Store slept Thanksgiving night.
Find the median of the data set.
What are 5.5 hours?
200
The formula for the interquartile range
What is
"IQR" = Q_3-Q_1
200
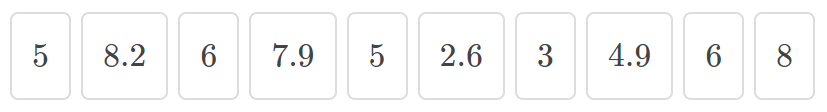
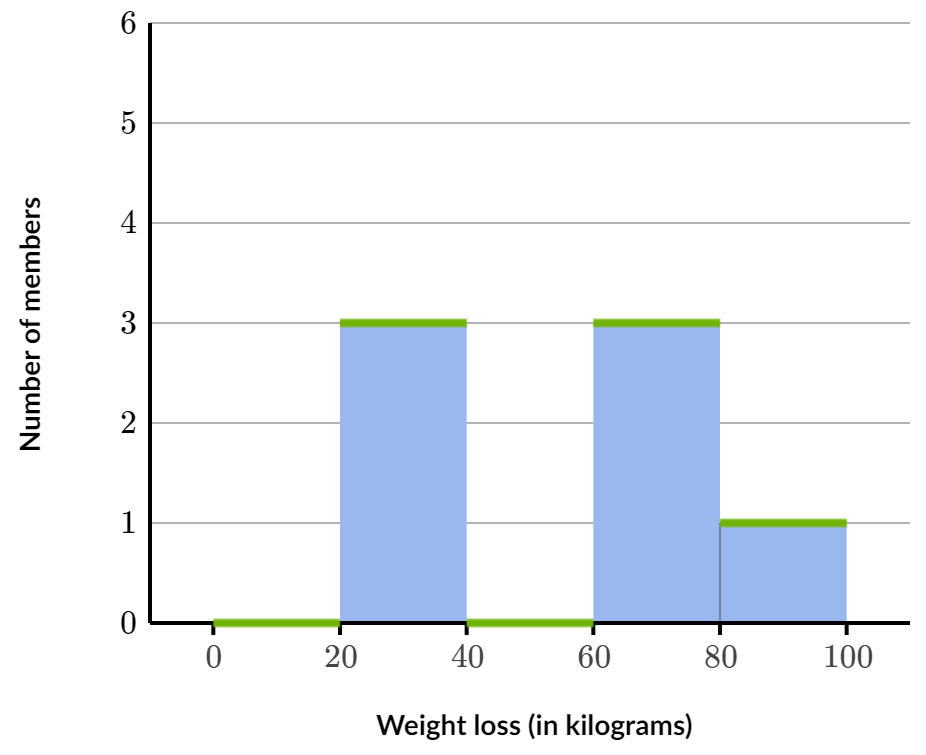
The histogram that represents the data:
61,90,31,35,69,37,78
(The data points represent the total weight loss (in kilograms) for each member of Omar's Final Fitness Team.)
What is
200
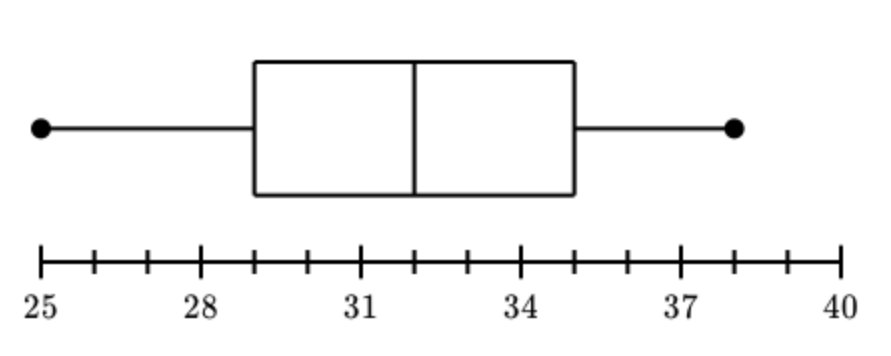
The range of the data in the box plot below:
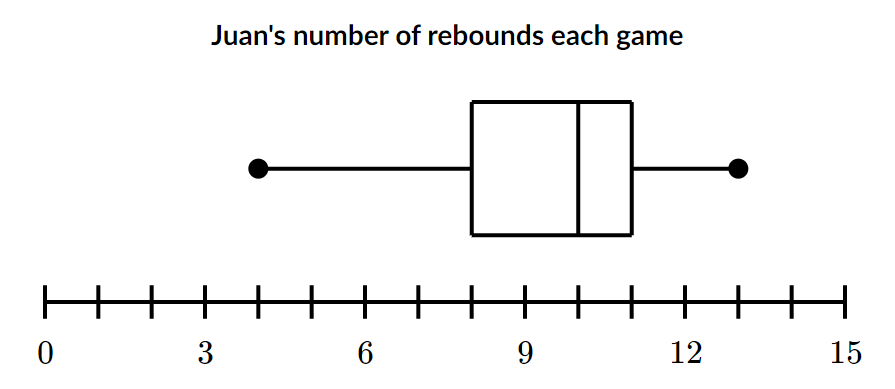
What are 9 rebounds?
200
The shape of the distribution shown below
What is left-tailed?
or
What is skewed to the left?
300
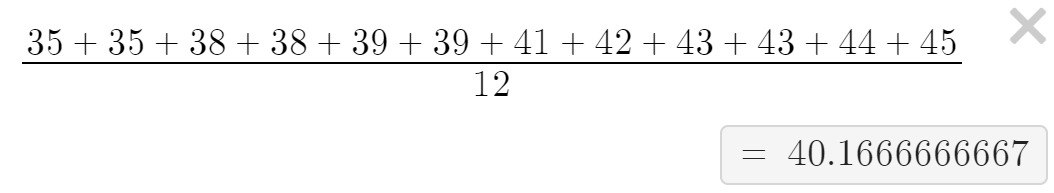
Hunter recorded the mass of each rock in his collection.
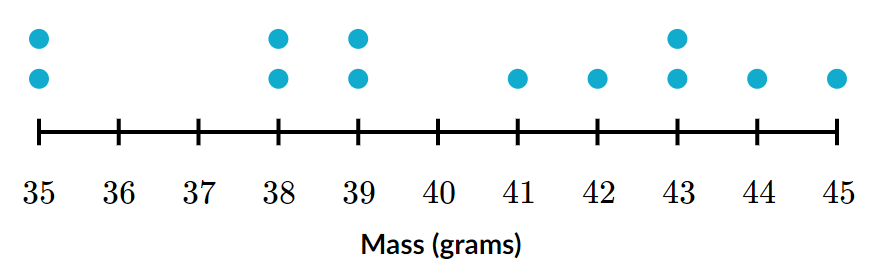
Find the mean mass rounded to the nearest tenth of a gram.
What is about 40.2 grams?
300
The lower quartile of the data in the box plot below:
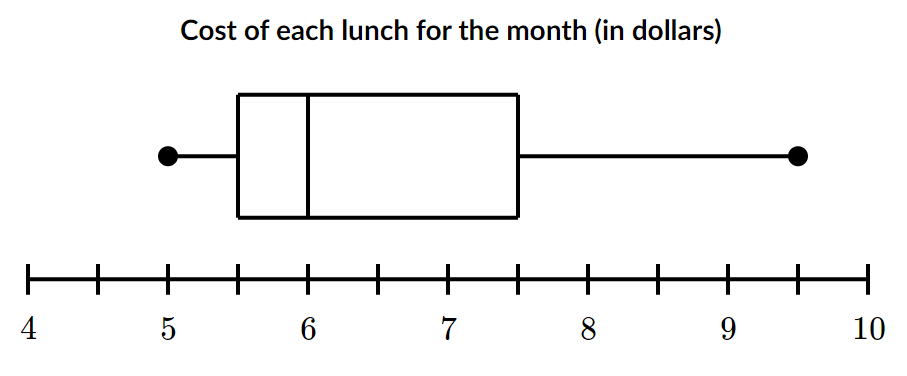
What is $5.50?
300
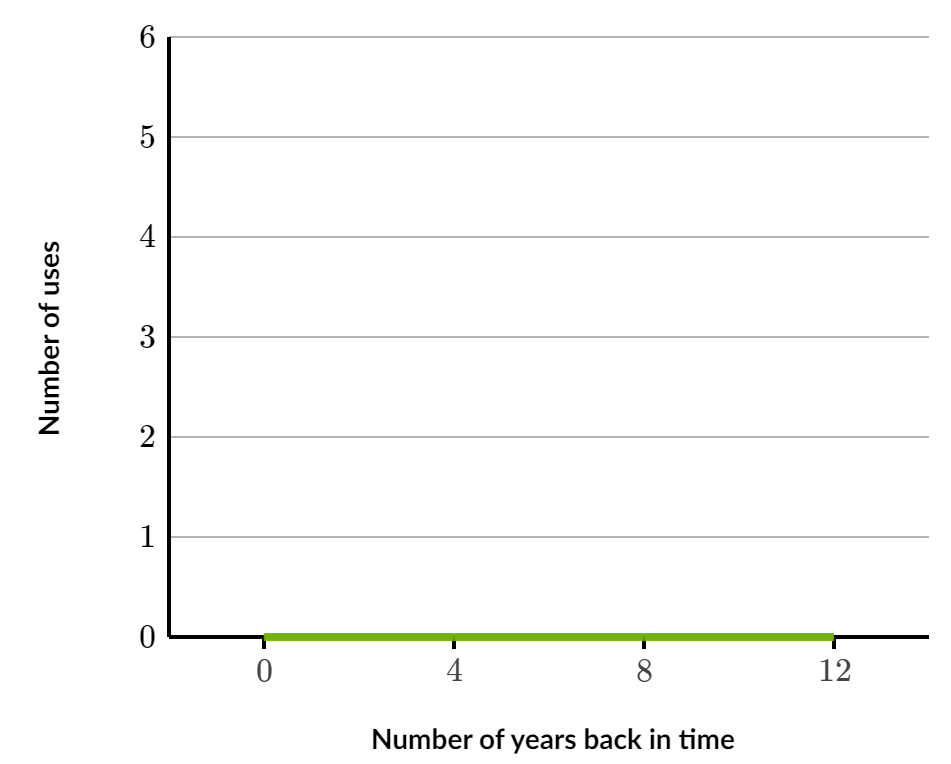
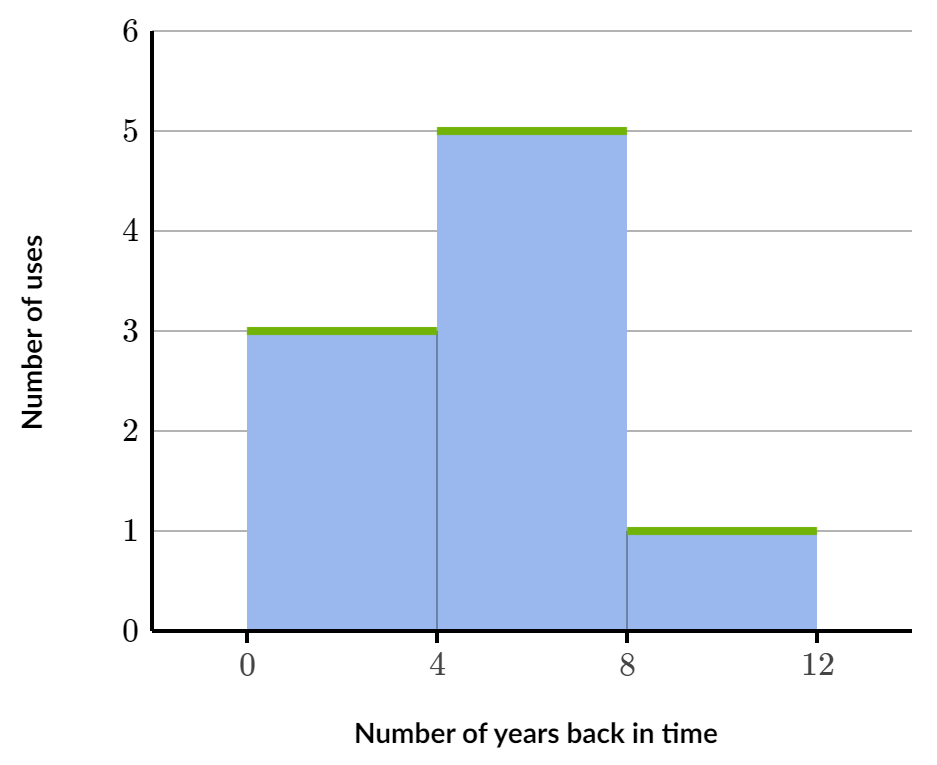
The histogram that represents the data:
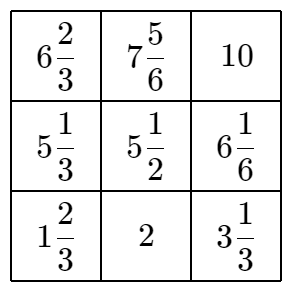
(Tresa received a magical time machine for her birthday. The data points above is the number of years she went back in time each of the nine times that she used the time machine.)
300
The maximum number of cavities that a patient had:
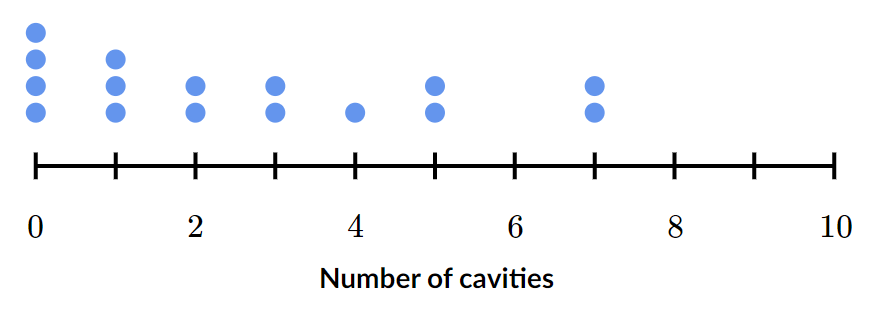
(The dot plot above shows the number of cavities for each patient seen by Dr. Hall last week. Each dot represents a different patient.)
What are 7 cavities?
300
The shape of the distribution shown below:
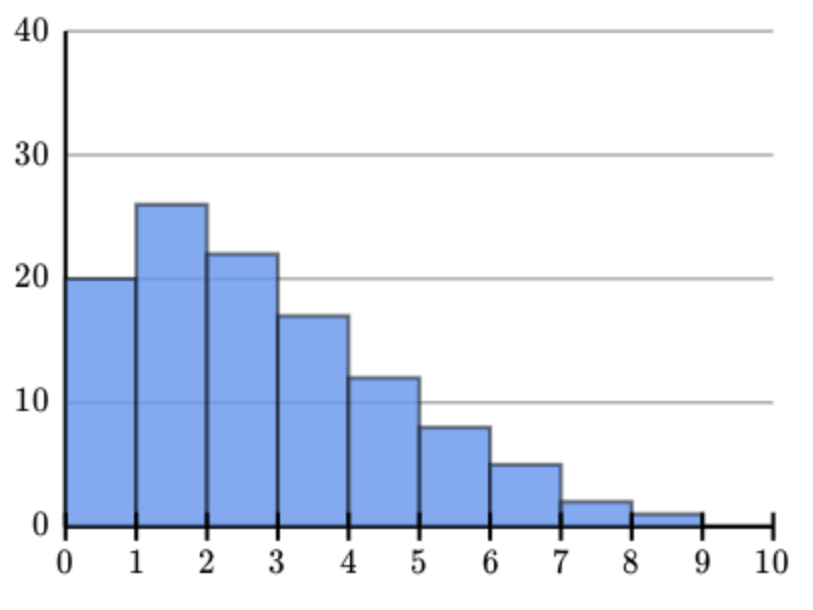
What is right-tailed?
or
What is skewed to the right?
400
The 13 members of a running club recorded the total distance they each ran in a week. Here are their distances:
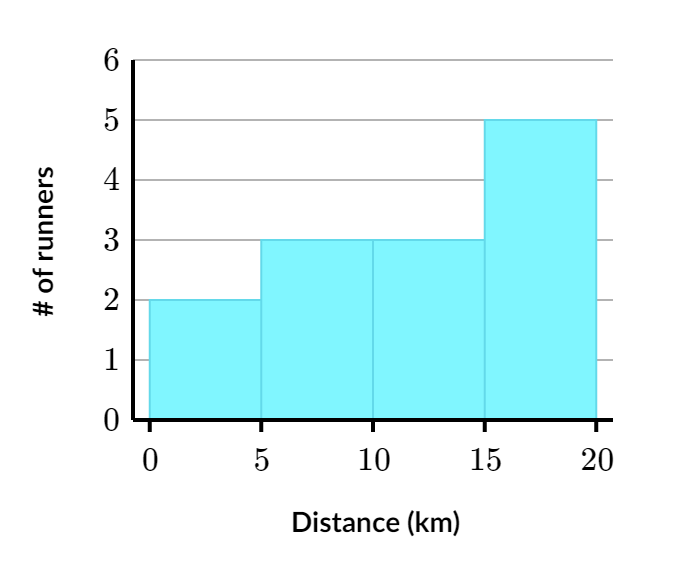
Which interval contains the median distance?
What is 10-15 kilometers?
400
Jay asked customers at his pet store how many pets they owned. Here are their responses:
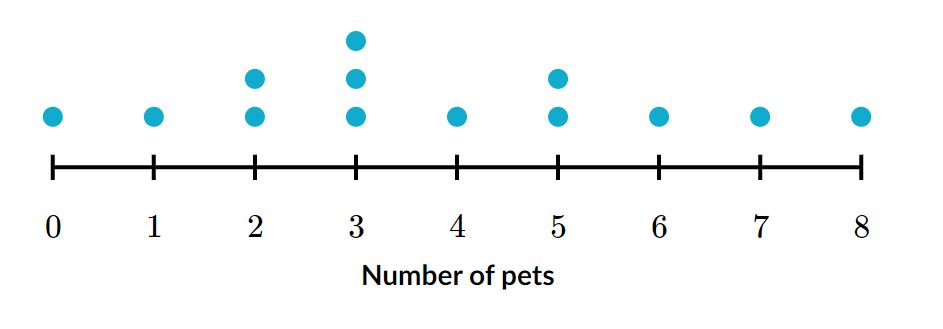
Find the interquartile range number of pets.
What is 3.5 pets?
400
The box plot that correctly summarizes the data:
41, 42, 43, 43, 43, 45, 47, 48, 50, 50
(The data points represent the number of cones sold at each of the ice cream stands in Koh Lanta.)
What is 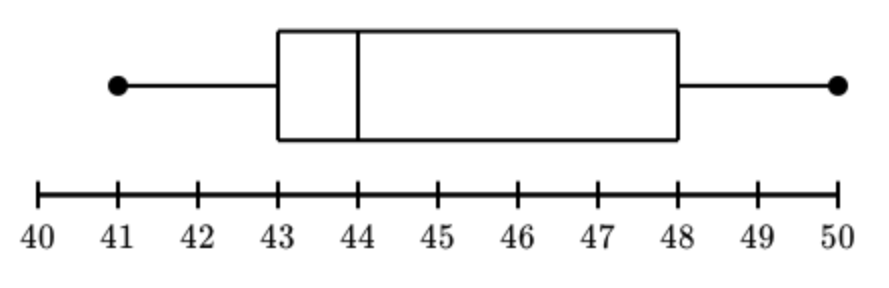
400
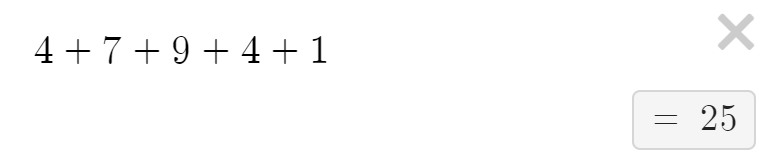
The number of houses on Prince Street:
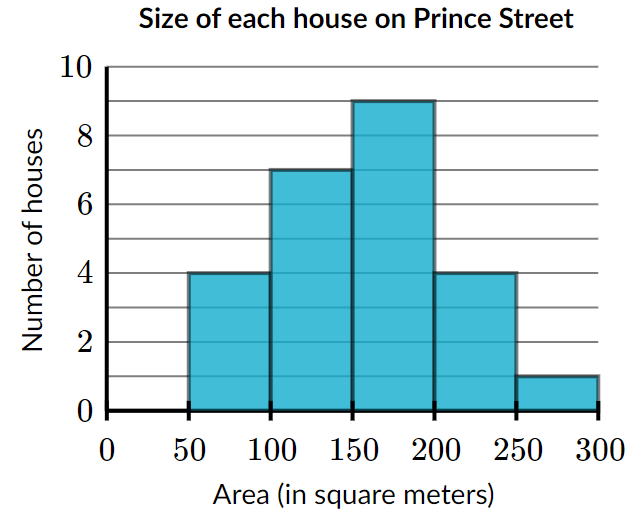
What are 25 houses?
400

The type of distributions sometimes described as a "bell" curve
What is a normal (symmetrical) distribution?
500
The following table shows the number of innings pitched by each of the Greenbury Goblins' starting pitchers during the Rockbottom Tournament.
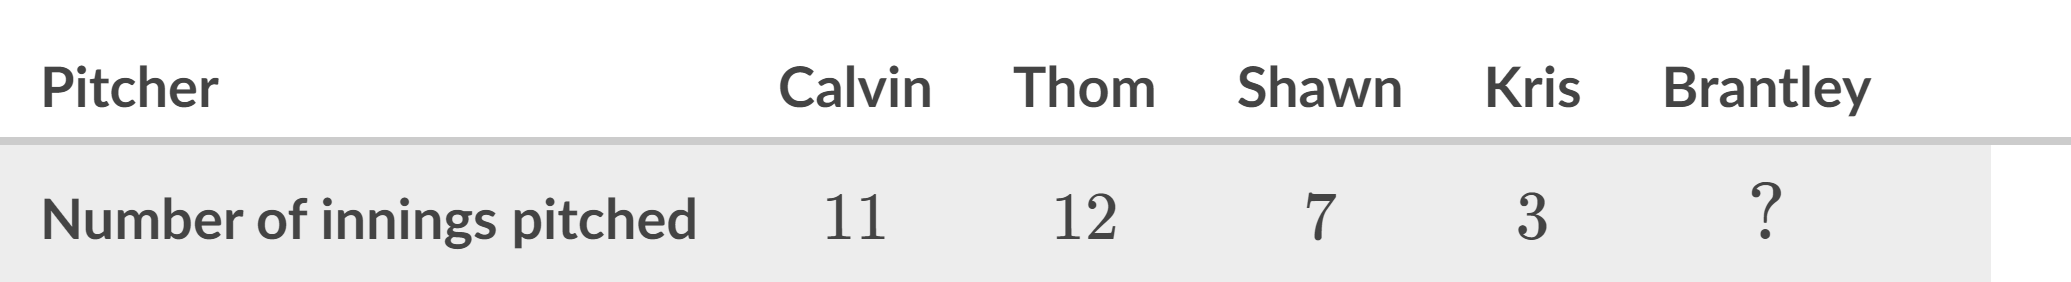
If the mean of the data set is 8 innings, find the number of innings Brantley pitched.
What are 7 innings?
500
The interquartile range of the data set:
(The data points represent the number of quesadillas each person at Toby's Tacos ate.)
What is 1 quesadilla?
500
A data set that could be represented by the box plot below:
(Hint: __, __, __, __, __, __, __, __, __, __, __ )
What is 25, __, 29, __, __, 32, __, __, 25, __, 38?
500
The interquartile range (IQR) of the data in the box plot below.
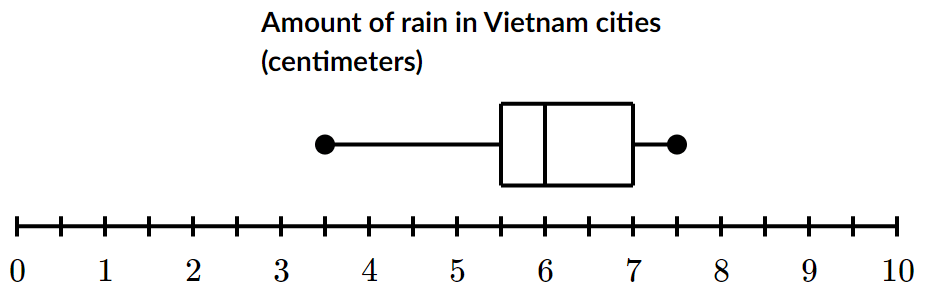
What are 1.5 cm?
500
The shape of the distribution of the ages of people currently on the CVHS campus
![]()
What is right-tailed?
or
What is skewed to the right?