Describing trends in scatter plots
Positive and negative linear associations
100
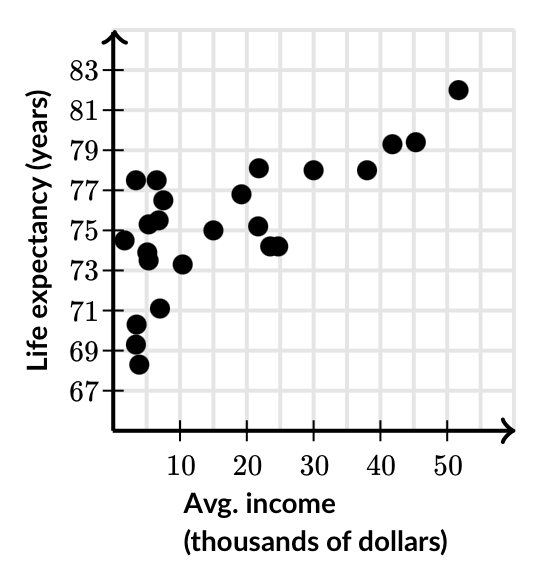
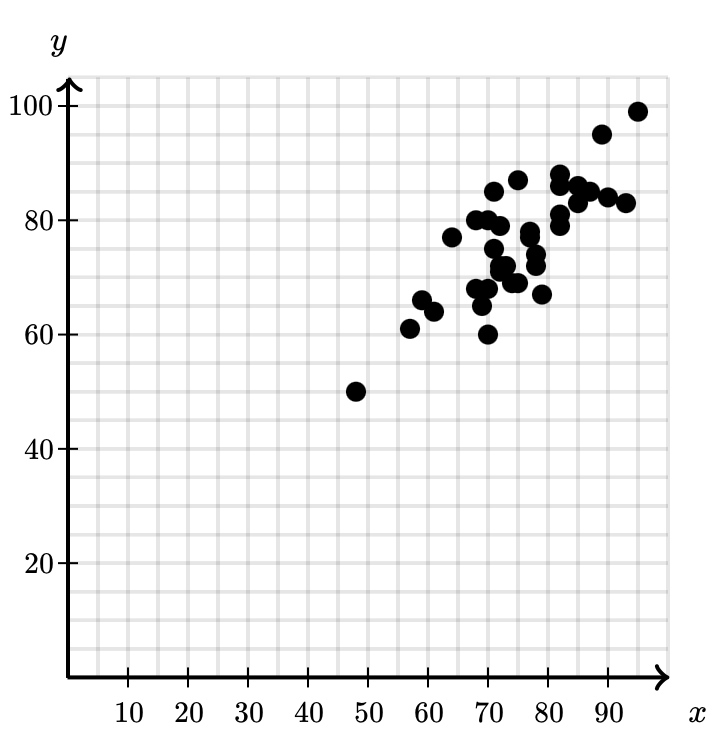
a.Countries with higher income tended to have longer life expectancies.
b.Countries with higher income tended to have shorter life expectancies.
c.There is no clear relationship between income and life expectancy.
a. Countries with higher income tended to have longer life expectancies.
100
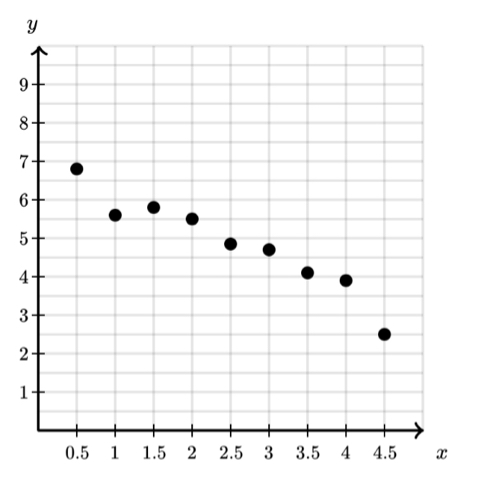
a. No association
b. Positive linear association
c. Nonlinear association
d. Negative linear association
d. Negative linear association
200
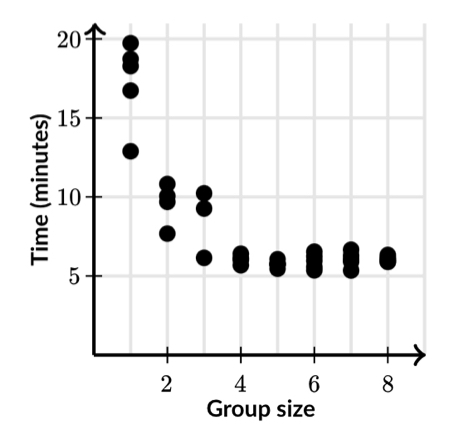
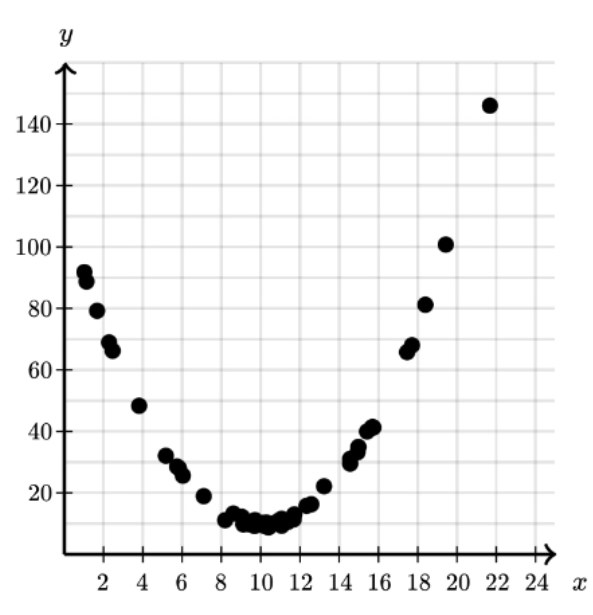
a. Larger groups tended to take more time to solve the puzzle.
b. Larger groups tended to take less time to solve the puzzle
c.There is no clear relationship between group size and the amount of time it took to solve the puzzle.
b. Larger groups tended to take less time to solve the puzzle.
200
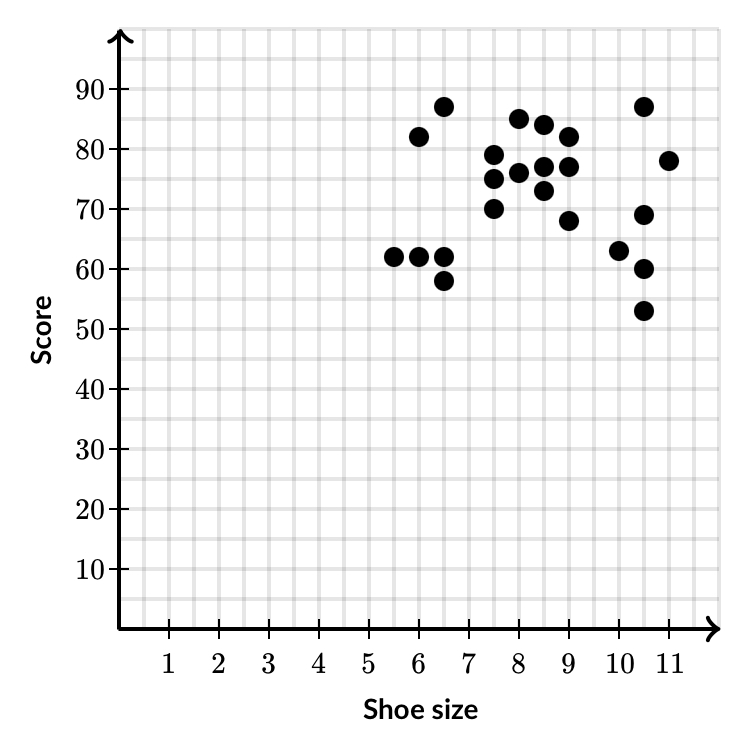 a. No association
b. Nonlinear association
c. Positive linear association
d. Negative linear association
a. No association
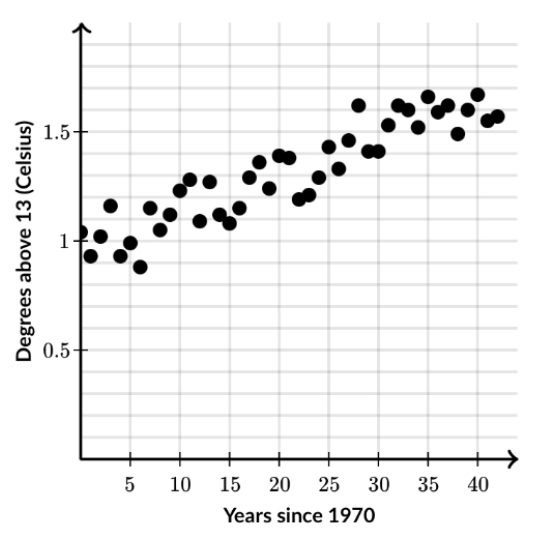
300
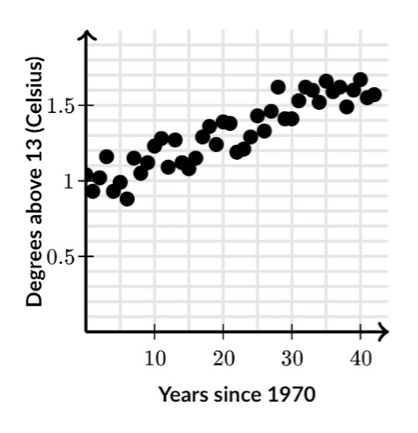
a. As time went by, the average temperature tended to increase.
b. As time went by, the average temperature tended to decrease.
c. There is no clear relationship between time and average temperature.
a. A time went by, the average temperature tended to increase.
300
 a. Positive linear association
b. Nonlinear association
c. Negative linear association
d. No association
b. Nonlinear association
400
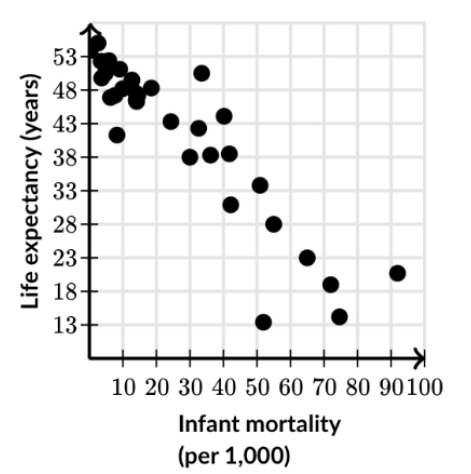
a. Countries with higher infant mortality rates tended to have longer life expectancies.
b. Countries with higher infant mortality rates tended to have shorter life expectancies.
c. There is no clear relationship between infant mortality rates and life expectanc.
b. Countries with higher infant mortality rates tended to have shorter life expectancies.
400
 a. Nonlinear association
b. Positive linear association
c. Negative linear association
d. No association
b. Positive linear association
500
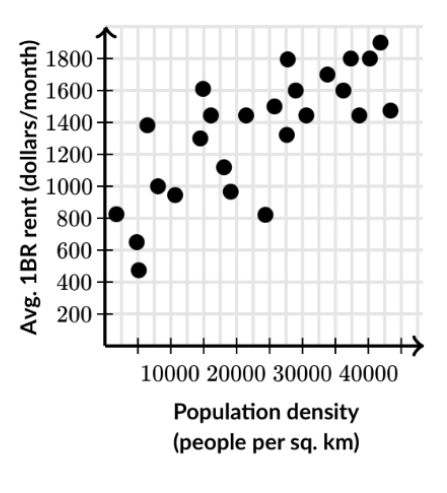
a. There is no clear relationship between population density and rent.
b. Cities with higher population densities tended to have lower rents.
c. Cities with higher population densities tended to have higher rents.
C. Cities with higher population densities tended to have higher rents.
500
a. Negative linear equations
b. Nonlinear association
c. Positive linear equations
d. No association
c. Positive linear equations