1
2
3
4
5
100
Is 30 a prime or composite number and why?
Composite
100
Is 53 prime or composite number and why?
Prime
100
Mrs. Ufford sold 12 boxes of cookies. Miss Peters sold 4 times the amount Mrs. Ufford sold. How many cookies did Miss peters sell total?
48 Cookies
100
There are 24 cans of soda in a pack. Show all the ways you can arrange the cans into an array.
1x24 Picture
2x12 Picture
3x4 Picture
100
What is a line plot used for?
Answer may vary.
To show/display a set of data
To organize data
200
What is the minimum of this graph?
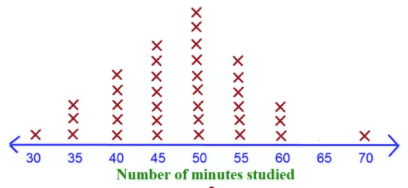
30 and 70 minutes
200
What is the mode of this data?
10
200
What is the maximum of this data?
50 minutes
200
Look at the following set of data. Which number is the outlier?
2, 3, 5, 1, 6, 9, 12, 19, 2, 6, 4
19
200
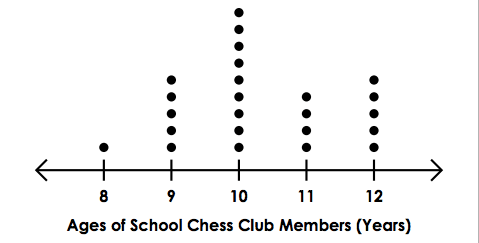
How many chess club members are 11 years old or younger?
19
300
What is the range of this set of data?
70-30=40
300
True or False?
When arranging data, it does not matter what order the data goes in?
False
300
The middle number in the data is known as the what?
Median
300
What is the difference between the highest and lowest test scores?
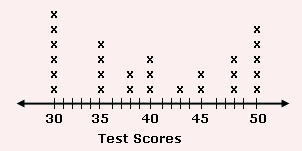
20
300
Look at the following data set:
8, 6, 5, 5, 3, 4, 3, 6, 7, 5, 6, 7, 8
What is the mode of this data set?
5 and 6
400
How many players are there total in the chess club?
24 players
400
How many protein shakes have 1 2/4 scoops or more in them?
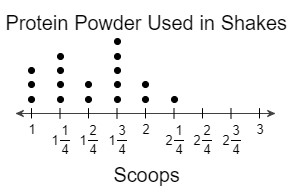
10 Shakes
400
None of them
400
Jessica has 14 apples. Her friend Grace has 4 times as many. How many more apples does Grace have than Jessica.
42 more apples
400
What word describes where most of the data is?
Typical
500
What is another name for the average of the data?
Mean
500
Find the mean of the data below:
16, 6, 5, 8, 10
16+10+8+6+5=45/5=9
500
Make a line plot with the numbers below and label the minimum and maximum
46, 69, 79, 64, 78, 46, 49, 64, 57, 53, 69, 46,
Answers will be drawn
min=46
max=70
500
265x3
795
500
Explain what each vocab word means.
Minimum, maximum, mode, median, outlier, typical, range
biggest number, smallest number, number that occurred the most times, middle number of the data, the number that does not belong in the set of data, where most of the data lies, the biggest number minus the smallest number