Identifying Variables
Is it a Function?
f(x)
Linear Understanding
Linear or non-linear
100
What is the domain in this ordered pair?
(-2,4)
-2
100
In order for a table, graph, or map to be a function _______________________________.
x- cannot repeat
100
z(x) = 2x – 1 for z(1)
z(1)= 1
100
A graph is linear when _________
the graph is a straight line
100
y=x2+2
non linear
200
What is the dependent variable in this graph?:max_bytes(150000):strip_icc()/Fuction-of-Time-58fd484f3df78ca159061c41.jpg)
speed
200
(5,2),(3,0),(2,2),(5,5)
nope x repeats (5,2) & (5,5)
200
t(x) = 4x – 2 for t(5)
t(x) = 18
200
A linear function contains _________ and ___________
one dependent variable & one independent variable
200
y=2x-4
linear
300
what is the range in this ordered pair:
(15,27)
27
300

Yes it is a function because x does not repeat
300
s(x) = 13x for s(6)
s(6) = 78
300
In a table, how do you determine whether the values represent a linear function?
ratio of change in y and in x is the same
300
(1,4), (2,12), (3,36), (4,108)
linear change is 1/3
400
What is the independent variable?
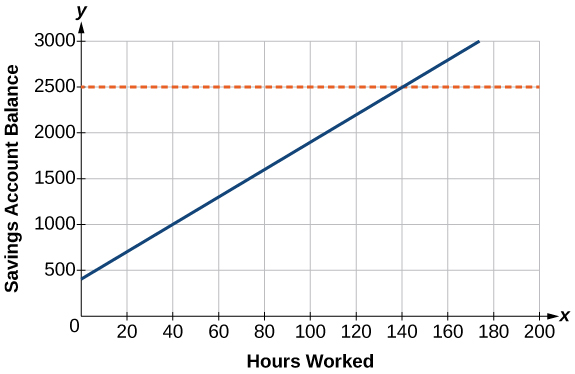
hours worked
400

It is a function because x does not repeat (vertical line test)
400
f(x) = x +22- 4 for f(7)
f(7) = 25
400
To determine if an equation represents a linear function x __________
cannot have an exponent other than 1
400
(2,3),(4,5),(6,7),(8,9)
linear rate of change is 2/2
500
List the independent and dependent variables:
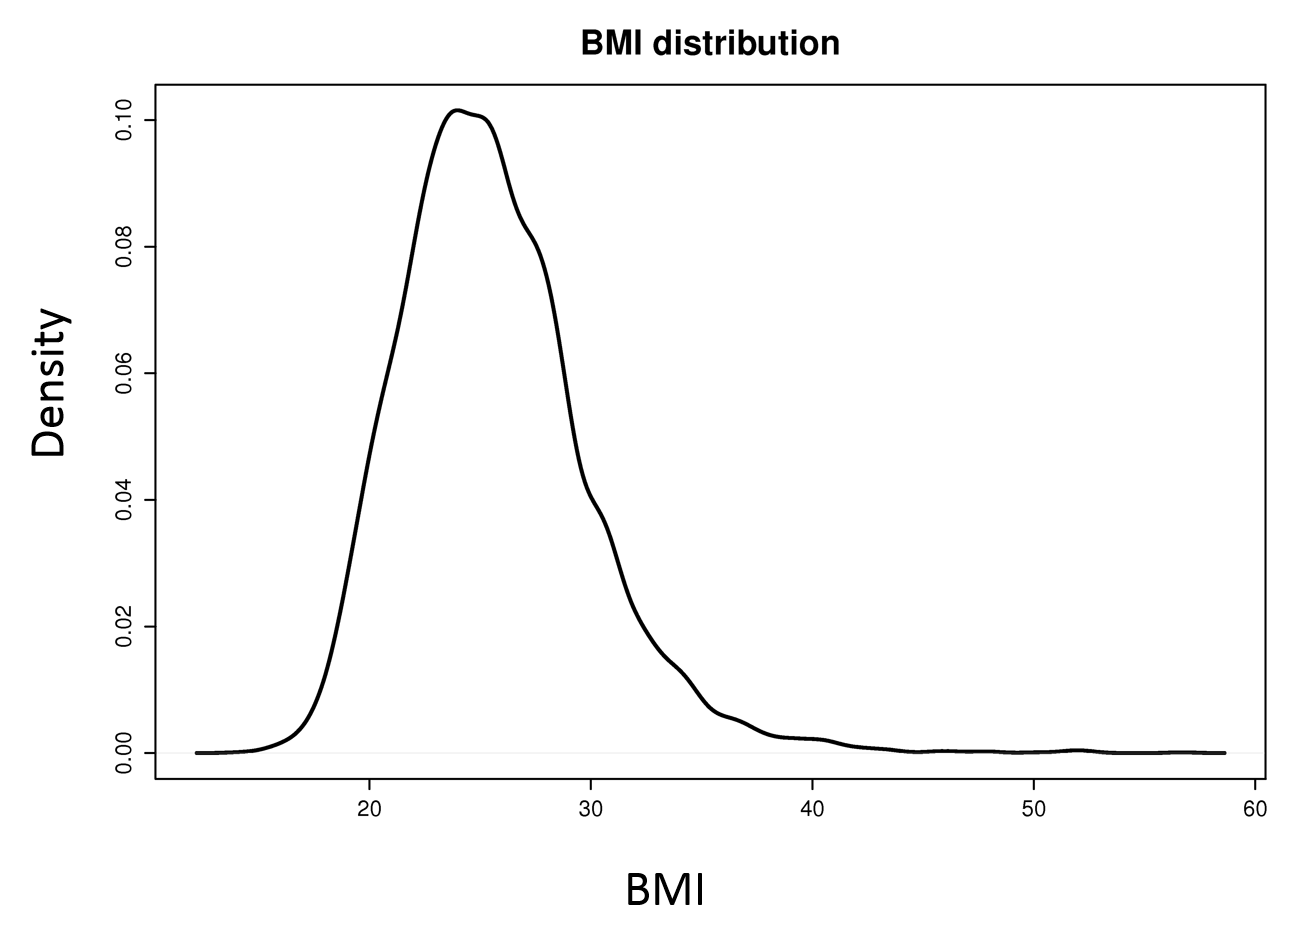
independent variable: BMI
dependent variable: Density
500
{(2, 5) (–3, –2), (4, 5), (6, 0), (–3, –2)}
No it is not a function because x repeats
500
h(x) = (23)x – 5 for h(2)
h(2)= 11
500
A non- linear function's graph ______________________
is not a straight line
500
(9,3),(14,8),(18,4),(21,9)
non linear