Chapter 2
Chapter 3
Chapter 4
Chapter 5
Chapter 6
100
What is Statistics?
The science and art of collecting, analyzing, and drawing conclusions
100
How do you display Categorical Data?
Frequency tables, relative frequency table, pie chart, and bar charts
100
How do you display quantitative data?
dotplots, stemplots, histograms, and boxplots
100
What type of skew is this?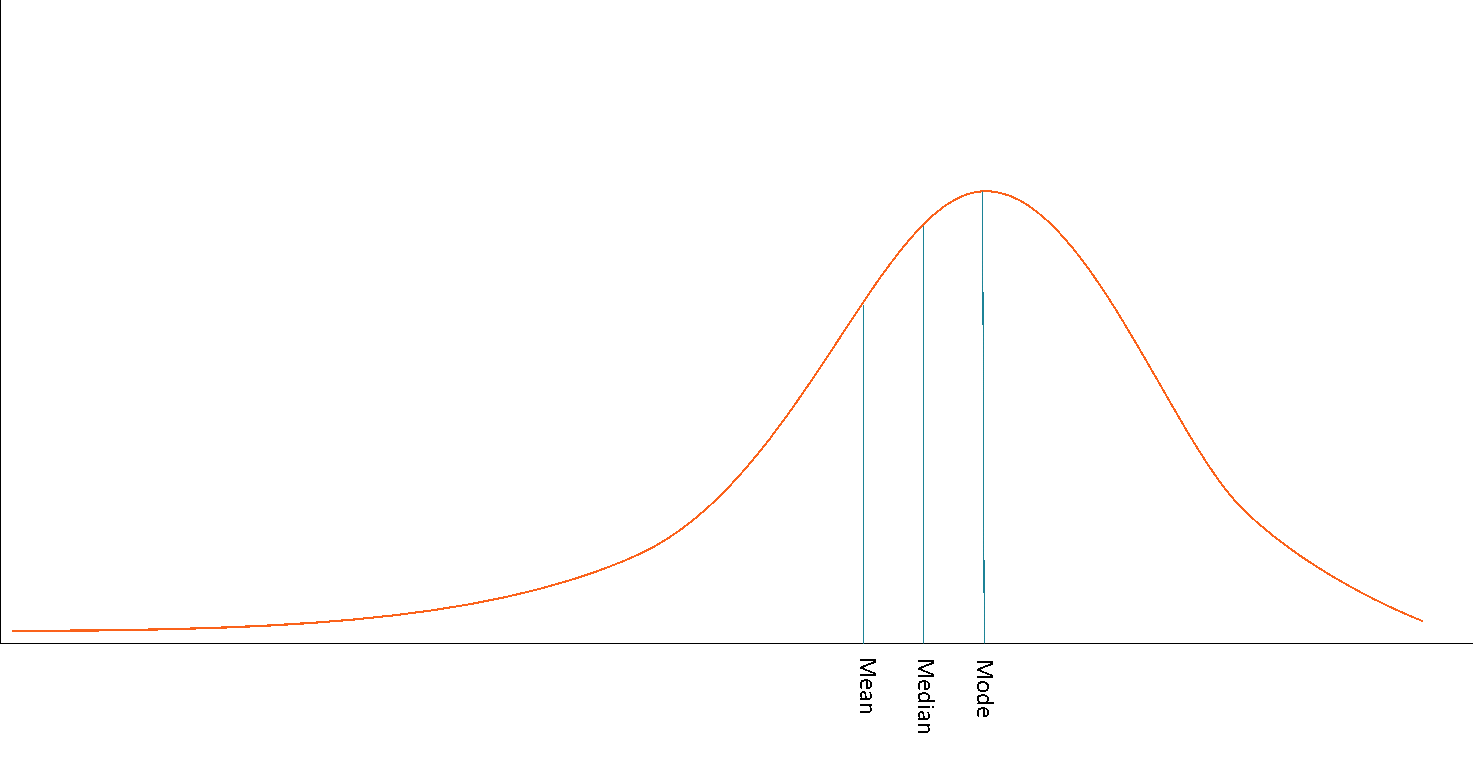
Left skew
100
What can a normal distribution be described as?
Symmetric, single-peaked, bell-shaped density
curve
200
What is Data?
Values along with their context.
Examples: Rainfall and it's relation to water available.
200
What is a Contingency Table?
Helps us visualize how one variable is related to another
200
What two parts is a stemplot separated into?
Stem and leaf
200
What does bimodal mean?
Having or involving two modes
200
What is the standard normal distribution?
Normal distribution with mean 0 and
standard deviation 1
300
What is a Categorical Variable?
Any variables where the data represent groups.
300
What is a Marginal Distribution?
Compares to the entire group
300
What does the five number summary consist of?
Minimum, maximum, lower quartile, upper quartile, median
300
What is the outlier rule?
If the datapoint is more than 1.5 IQR below the first quartile or above the third quartile
300
What is a z-score?
A statistical measurement that describes a value's relationship to the mean of a group of values
400
What is a Quantitative Variable?
Any variables where the data represent amounts (e.g. height, weight, or age).
400
What is a Conditional Distribution?
Compares to a subgroup
400
What is SOCS?
Shape: Number of “humps” or modes along with symmetry and skewness
Outliers: Gaps and outliers
Center: Median or Mean
Spread: Range, IQR, standard deviation, or clusters
400
How do you enter one variable statistics into the calculator?
Press [STAT] and select 1:Edit. 2) Enter in the data one at a time into L1, pressing [ENTER] after each entry. 3) Press [STAT], scroll to highlight CALC. 4) Select 1: 1-Var Stats and press [ENTER].
400
What is a shorthand used to remember the percentage of values that lie within 1, 2, and 3 deviations?
68-95-99.7 rule
500
What are the 5 W's (and H)?
Who, What, Where, Why, When, How
500
Which type of chart is best for displaying conditional distributions?
Segmented Bar Chart
500
What are the different modes?
Unimodal: one mode
Bimodal: two modes
Multimodal: more than 2 modes
Uniform – no modes a flat distribution
500
What is imperative in your response when deciphering two data sets?
Context
500
What do you use to find probabilities corresponding to ranges of z-scores
z-table