Survey
Graph
Box and Whisker
Vocabulary
Standard Deviation
100
The entire group of individuals or elements that a researcher wants to draw conclusions about.
What is population?
100
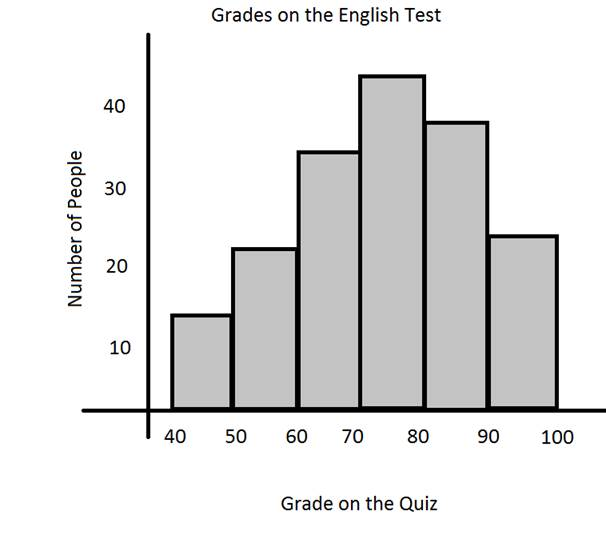
The name of this type of graph
What is a histogram?
100
The difference between the 1st and 3rd quartile.
What is the IQR?
100
The average of the data.
What is the mean?
100
If take this from the variance to find the standard deviation.
What is the square root?
200
A smaller group of individuals selected from a larger population that is surveyed to gather data and make inferences about the entire population.
What is sample?
200
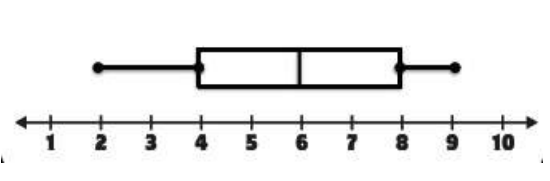
The name of this type of graph
What is a box and whisker plot?
200
All the points listed on a box and whisker plot.
What is the minimum, 1st quartile, median, 3rd quartile, and maximum?
200
A measure of center of the data.
What is central tendency?
200
The standard deviation tells me this about the data.
What is the spread of the data?
300
The graph below is a survey of college students

1,000 college students
What is the number of people surveyed?
300
Use the data below to create a stem and leaf plot.
2, 5, 8, 10, 11, 15, 16, 17, 22, 25, 29, 30, 33, 37
Stem Leaf
0 2 5 8
1 0 1 5 6 7
2 2 5 9
3 0 3 7
300
The box and whisker plot tells you this about the data.
What is the spread and central tendency of the data?
300
A measure of how far apart each data point is on average.
What is the spread of the data?
300
Find the standard deviation using the following variance
variance= 25
standard deviation= 5
400
The population was selected by drawing random names out of a hat
What is simple random?
400
A class is asked their favorite pizza topping. Create a circle graph with percentages using the data below.
Pepperoni- 8 Sausage- 4 Cheese- 5 Supreme- 3
Pepperoni- 40% Sausage- 20%
Cheese- 25% Supreme- 15%
400
When I have a box and whisker lot and I know there is an outlier, I would use this.
What is the Inner Quartile Range
400
How far apart the 1st and 3rd quartiles are from each other.
What is the IQR
400
Find the variance using the following standard deviation
standard deviation= 5.67
Variance= 32.1489
500
The population was chosen by every 3rd customer that walked into the restaurant.
What is systematic?
500
Create an accurate graph with this data
2, 4, 4, 7, 8, 10, 12, 15
*Check with Coach Linnell
500
Use the data below to create a box and whisker plot
100, 110, 110, 120, 130, 140, 140, 150, 150, 160, 180, 200
*Check with Coach Linnell
500
How far apart the largest data point is from the smallest data point.
What is range?
500
Find the standard deviation of the data below
25, 28, 30, 22, 18, 20, 24, 33
Variance= 22.75
Standard Deviation= 4.77