Graphs
SOCS
IQR
Empirical Method
Mr H
100
Whats the difference between categorical and quantitative data?
How many vs Which
100
What does SOCS stand for
Shape, Outliers, Center Spread
100
Why is IQR better to use with outliers?
It uses the median which is resistant to outliers.
100
When are you allowed to use the empirical method?
When your graph has a normal curve and no outliers
100
What sport did Mr H play?
Volleyball
200
Can you use SOCCS on a bar graph? Explain why?
No, because bar graphs are categorical data so we can dictate how it looks by moving categories.
200
When you have
mode < median < mean
What shape is your graphical representation, and which two graphical representations does this apply to?
Right Skewed and for Box plots and Histograms
200
What is the formula for solving the upper and lower bound for IQR?
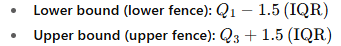
200
What are the percentages of data that lie 1,2, and 3 standard deviations away from the mean?
68, 95, 99.7
200
What was Mr H job before subbing?
Head Coach at a college
300
6, 14, 22, 31, 39, 57, 60
For a stem leaf plot, what would the stems be?
0,1,2,3,4,5,6
300
What are the two methods for finding outliers and when they are best used?
IQR method when there are outliers
Standrd deviation method when there are no outliers
300
What is the main graphical representation with the IQR?
Dot plot
300
What is the z score formula
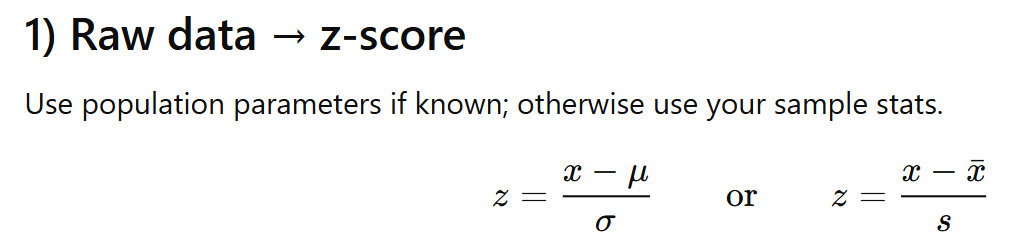
300
How old is Mr H
26
400
What is the formula for mean?
add up all the data and divide by how much there are
400
What is the formula to find outliers using standard deviation?
Mean +- 2(standard deviation)
400
What is the 5 number summary and how do we find th IQR?
Max, Min, Median, Q1 and Q3
Q3-Q1
400
What does the z score represent?
How far away the point is from the mean in standard deviations
400
Where did Mr H go to high school?
FV
500
What is the mode?
The data that appears the most?
500
When comparing two graphs, what do I have to add on top of SOCS?
A comparative sentence comparing the overarching graphs
500
When you find the 5-number summary, how are you splitting your data up?
Into quarters
500
What is the percent of data below a z-score of 0.54?
0.7054 (70.54%)
500
Where did Mr H live before at last 5 years?
North Dakota
600
What dictates how we interpret SOCS besides the data?
The graphical represetation you use will ultimately dictate how you use SOCS. Some graphs display different things.
600
what does it mean for a statistic to be resistant?
The statistic is not affected by outliers too much.
600
What about our data needs to be true to use the IQR over the empirical method?
There are outliers and the data is not in a normal distribution
600
What is the percent of data above a z-score of 0.54?
0.2946 (29.46%)
600
Where did Mr H go to college?
University of Jamestown
700
How do you determine the bin lengths in a histogram?
subtract the max and min and divide by how many bins you want.
700
Where are the humps/peaks in a right and left skewed graph?
left skewed mean the hump is on the right and vice versa
700
What three data information do you need to draw the box in the boxplot?
Q1, Q3, Median
700
What is the z score for 65th percentile?
0.385
700
What did Mr H get his masters in?
Sports Leadership
800
If a data is on the border of the bin, which bin does it go into?
It goes into the bin in front unless its in the last bin
800
What is the best method for finding outliers when there are outliers?
IQR lower and upperbound method
800
What does the IQR represent?
The distance that middle 50% of your data cover
800
What is the percent between z-score of -0.28 and 0.35?
.2471 (24%)
800
What is Mr H relationship to Mrs. Tran?
I am her long term sub
900
What is the difference between frequency and relative frequency?
frequency is how often it occurs and cumulative is adding up the frequencies
900
How do you describe the spread of a unimodal and bimodal graph?
Either using the standard deviation or IQR for the unimodal and for the bimodal using the mode
900
What does the width of the box tell us about the spread of data?
smaller it is the more tight the data is
900
What is the raw data if z-score is -2.3
The mean is 23, and the standard deviation is 5
11.5
900
What is Mr H ethnic background?
Vietnamese