The Formula Is:
Point Estimates
You Pick: z or t
Make an Interval
So what?
100
sigma/sqrtn
The standard deviation of the sample distribution for the mean
100
Find the sample mean barx derived from a 95% confidence interval for squirrel weights with a lower bound of 350 grams and an upper bound of 410 grams.
380 grams.
100
This critical value must be used when constructing a confidence interval for a population proportion, provided the Success/Failure condition nhatpge10 and n(1−hatp)≥10) is met.
z-score z^star
100
In a random sample of 100 students, 60 say they prefer digital textbooks. Using a critical value of z^star=1.96 , create a 95% confidence interval for the true proportion of students who prefer digital textbooks.
(0.504, 0.696)
100
We use check this condition so that we can ensure that there is no bias in our sample.
Random
200
mu_hatp=p
The mean of the sampling distribution for a proportion
200
Find the point estimate hatp for a proportion of voters, given that the confidence interval spans from 0.44 to 0.50.
0.47 (or 47%)
200
When estimating a population mean and the population standard deviation (σ) is unknown, researchers must use this distribution to account for the extra variability of the sample standard deviation (s).
The t-distribution (or t-score)
200
A study of 16 marathon runners found a mean finish time of 240 minutes with a sample standard deviation of 20 minutes. Using the t-table for df=15 ( t^∗=2.131 ), this is the 95% confidence interval for the true mean finish time.
(229.35, 250.65)
200
If we check nhatpge10 and n(1-hatp)ge10 and both cases are true, then we can use a normal distribution. What is this condition called?
Large Counts Condition
300
sigma_hatp=sqrt((p(1-p))/n
The standard deviation of the sample distribution for proportions
300
Find the upper bound of a 90% confidence interval for commute times, given a point estimate of 28.5 minutes and a lower bound of 23.2 minutes.
33.8 minutes
300
This is the specific distribution used for a sample of 40 lightbulbs where the goal is to estimate the mean life span, and the population standard deviation is explicitly provided as 100 hours.
The z-distribution (or Normal distribution)? (Note: We use z because σ is known, even though it's a mean).
300
A survey of 400 residents found that 100 support a new park. This is the 90% confidence interval ( z^∗=1.645 ) expressed in the format:
hatp+- Margin of Error
0.25±0.0356?
300
In the formula for a confidence interval, this specific term represents the distance from the point estimate to either the upper or lower bound.
Margin of Error
400
s_hatp=sqrt((hatp(1-hatp))/n
The STANDARD ERROR of the sampling distribution for proportions
400
Find the point estimate for a population mean where the upper bound of the interval is 102.4 and the margin of error is known to be 6.4.
96
400
This value is required for an interval where the sample size is 15, the population is approximately normal, and the only available measure of spread is the sample standard deviation.
A t-score (with df=14)
400
You collect a sample of 25 soda cans and find a mean volume of 12.1 oz and a sample standard deviation of 0.1 oz. To construct a 99% confidence interval, you must first identify this specific t^∗ critical value from the table.
2.797
400
For a sample of 100 people where the sample proportion hatp is 0.4, this is the value of the Standard Error sqrt((hatp*(1-hatp))/n
0.0489
500
mu_(barx_1-barx_2)=mu_1-mu_2
The mean of the sampling distribution for two populations
500
This specific value remained identical at 17.0 for both Amy’s narrow interval (14.2, 19.8) and Bob’s wide interval (12.5, 21.5), despite them using different confidence levels.
The Point Estimate (or Sample Mean)
500
As the sample size (n) increases toward infinity, the shape of the t-distribution changes until it becomes identical to this other distribution.
The Standard Normal Distribution (or z-distribution)
500
A 95% confidence interval for the mean weight of apples is (145g, 155g). If the sample size was 100 and the population standard deviation (σ) was known to be 25g, this is the original sample mean and the z-score used, expressed as a coordinate pair ( barx, z^ast ).
You can enter your answer in 1 minute.
(150, 1.96)
500
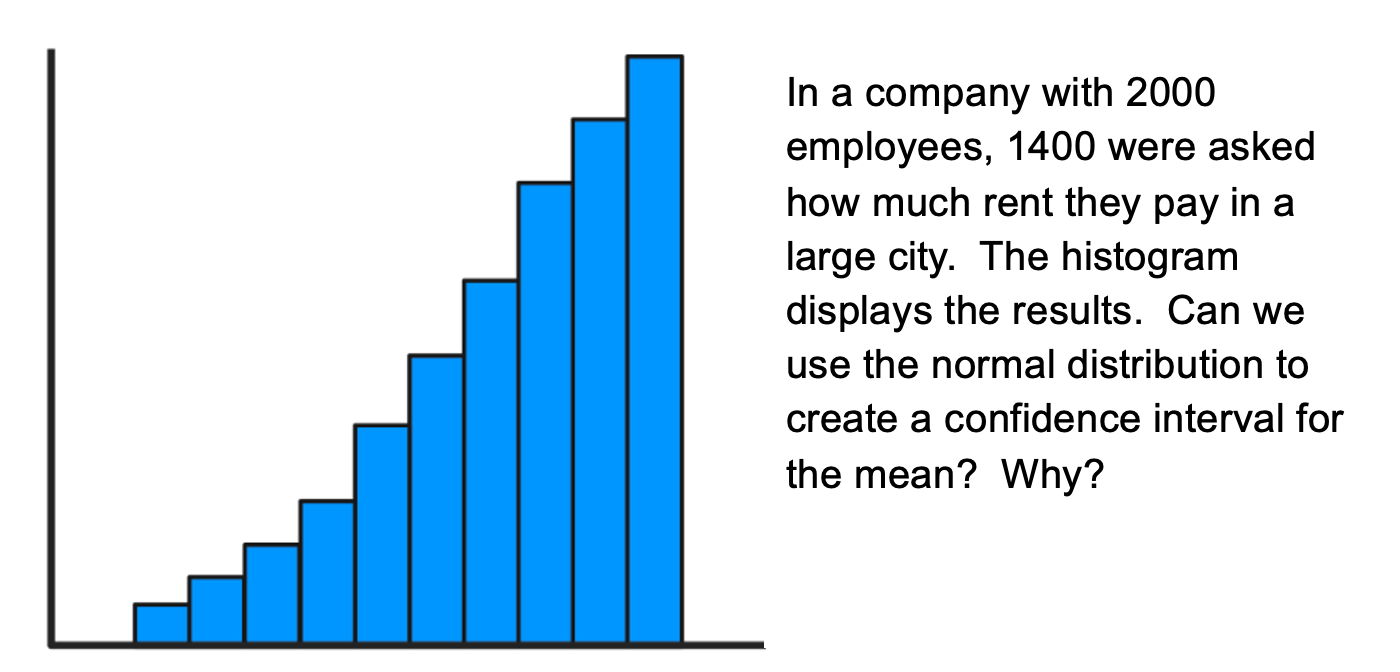
NO. The 10% condition has not been met.
1400 is not less than or equal to 2000 of all adults.