Classifying and Collecting Data
Frequency Tables
Measures of Centre and Spread
Dot Plots and Bar Graphs
Stem-and-leaf Plots
100
Data that is placed in categories
Categorical
100
Number of people that participated in the survey.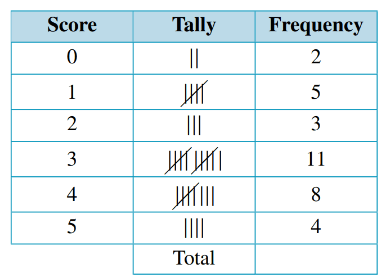
33
100
Another word for 'Mean'?
Average
100
The name of the line at along the bottom of a graph/plot
x-axis
100
The part of a stem-and-leaf plot that usually holds 'Tens'
Stem
200
Numerical data that uses decimals
Discrete
200
Most frequent Score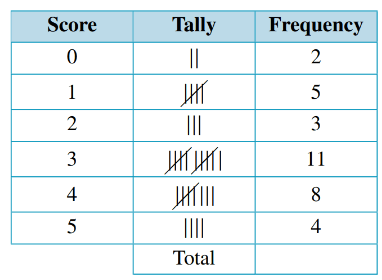
3
200
Determine the Mode:
1, 4, 7, 3, 4, 2
4
200
The type of data displayed on dot plots
Numerical
200
Numbers in the leaf must be put in ________
Order
300
Collecting data from an entire population
Census
300
Number of people that scored less than 3
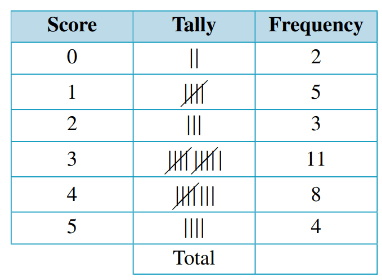
10
300
Calculate the Range:
6, 8, 3, 4, 7
5
300
The majority of students do sport on how many days a week?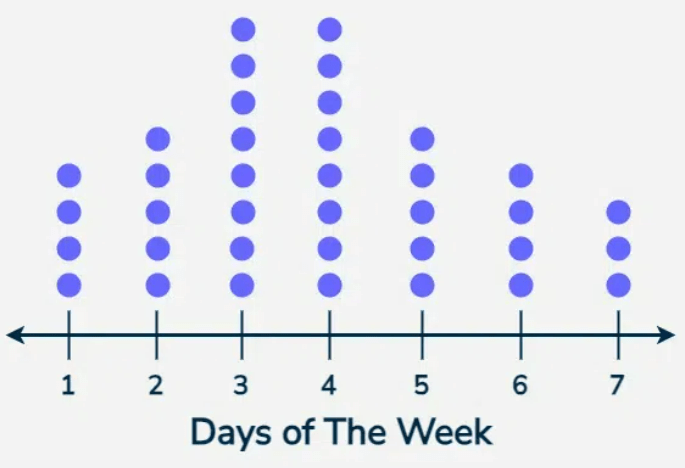
3 & 4
300
What is missing in the following stem-and-leaf plot?
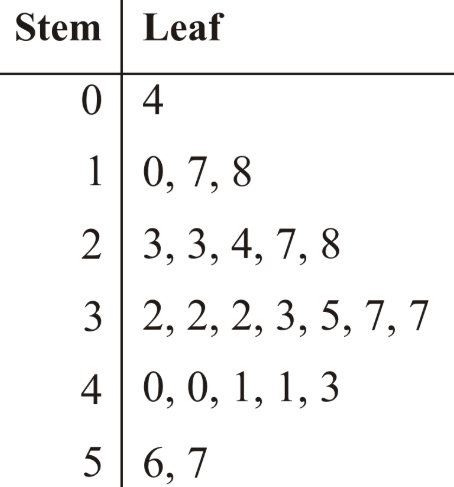
Key
400
The name for a small group of people surveyed
Sample
400
Number of people who scored 3 or more
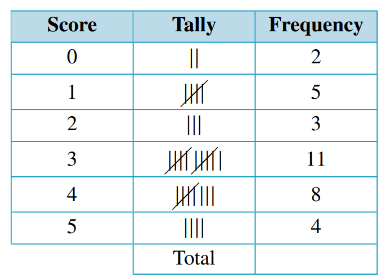
23
400
Calculate the Mean:
2, 1, 4, 2, 1
10
400
The number of students who prefer swimming
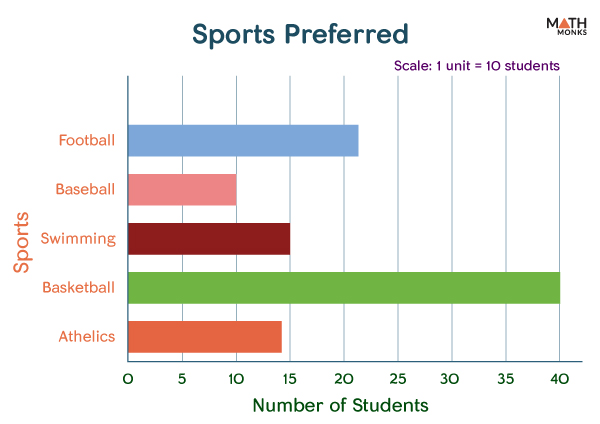
150
400
The mode of this data set
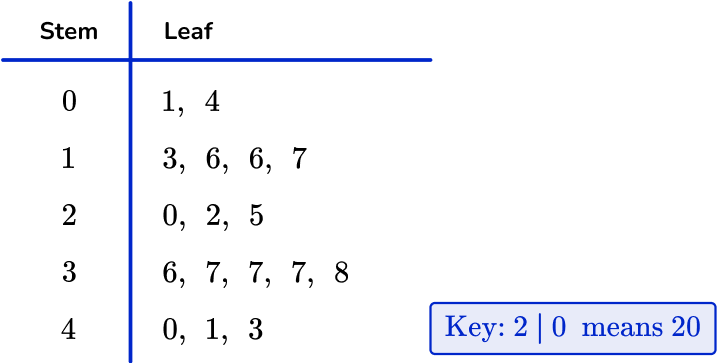
37
500
Categorical data that has no correct order
Nominal
500
Fraction of people surveyed who scored 3 (Must be simplified)
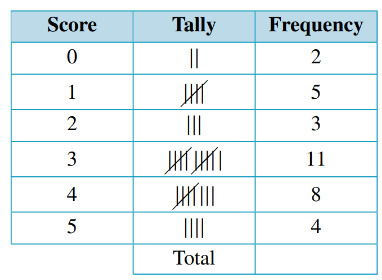
1/3
500
Determine the Median
2, 5, 3, 6, 4
4
500
The number of students who chose a sport beginning with 'B'
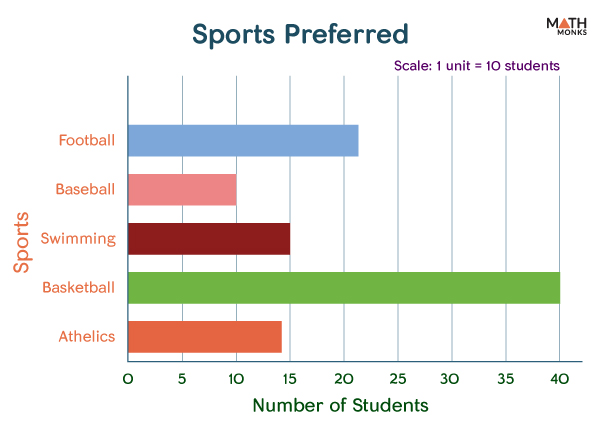
500
500
The median of this data set
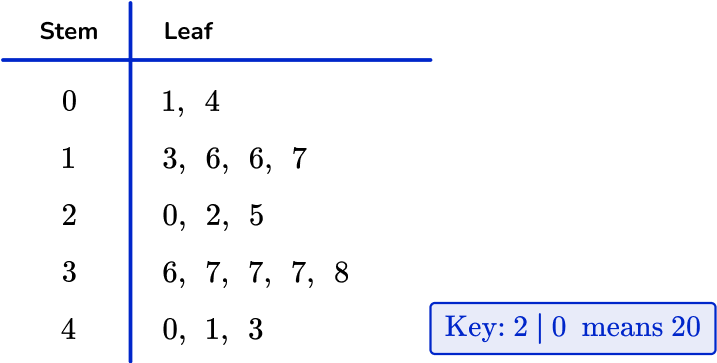
25