Statistical Questions
Miscellaneous
Median
Histograms
Dot Plots
100
Is this a statistical question? Explain.
How tall are 6th graders?
Yes, not all sixth graders are the same height.
100
Identify the peak(s) in the dot plot.
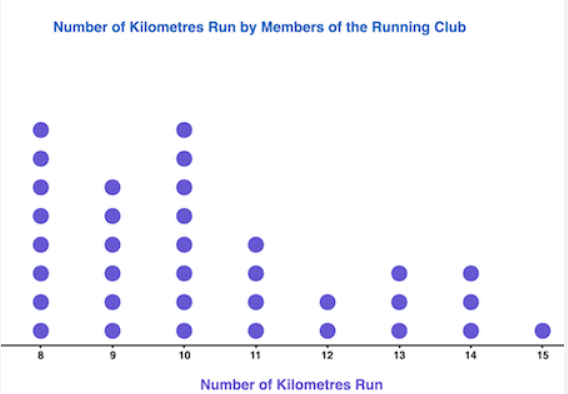
8 km, 10 km
100
Find the median:
13, 18, 13, 14, 13, 16, 14, 21, 13
What is 14?
100
How many people scored greater than 3?
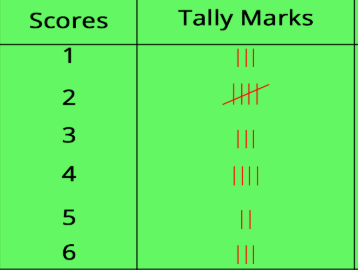
8 people
100
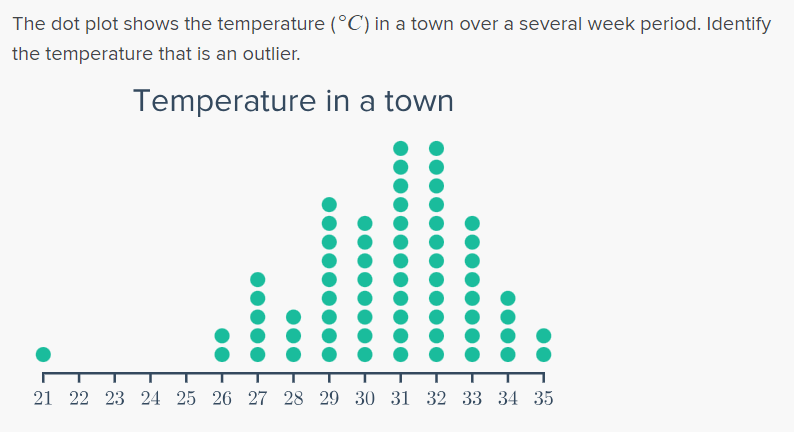
What is 21 degrees Celcius?
200
Is this a statistical question? Explain.
How many pencils does Mrs. Kitchen have?
No. There is only one correct answer.
200
How many trees are taller than 74 feet?
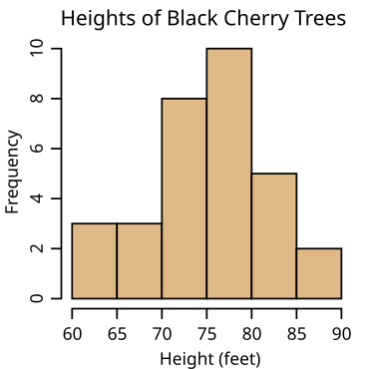
17 trees
200
Find the median:
12, 13, 13, 15, 10, 11, 11, 11, 10, 9
What is 11?
200
How many people were surveyed?
20 people
200
How many cars have more than 2 passengers?
Passengers in Cars on Rt. 95
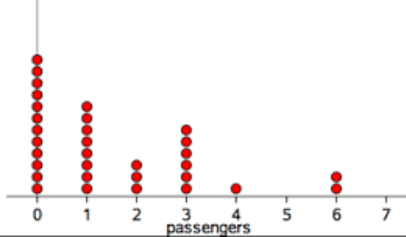
What is 9 cars?
300
Which statistical question below would provide data that could be used to make a line (dot) plot?
What is your favorite season?
Who do you have for a health teacher?
What color is your room painted?
How many siblings do you have?
How many siblings do you have?
300
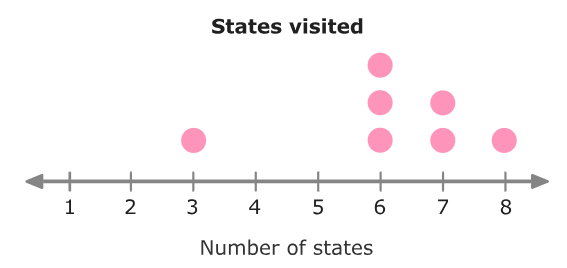
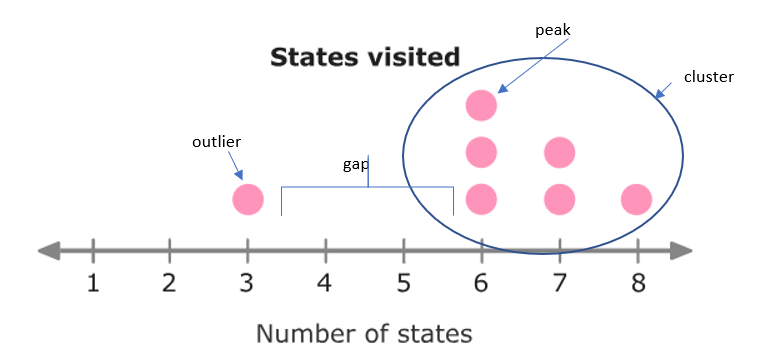
Draw the dot plot. Identify the cluster(s), peak(s), and gap(s).
300
Ron sold 15 raffle tickets, Jan sold 37, Claudia sold 23, Nathan sold 47, Erin sold 30, and Olivier sold 47. What was the median number of tickets sold?
What is 33.5 tickets?
300
How many trees are in the data set?

31 trees
300
How many people don't eat breakfast?
How many people take more than 10 minutes to eat breakfast?
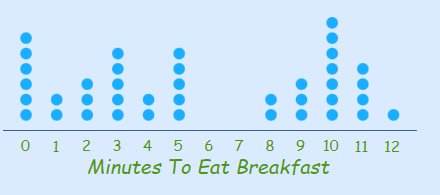
6 people
5 people
400
Write a statistical question that could provide the answers below.
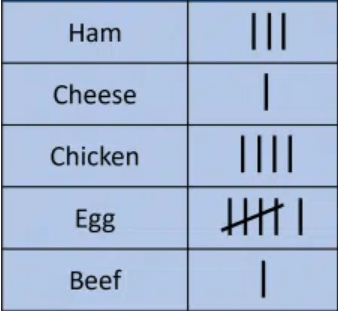
What is your favorite kind of sandwich?
400
What fraction of people ordered less than 4 gallons of paint?
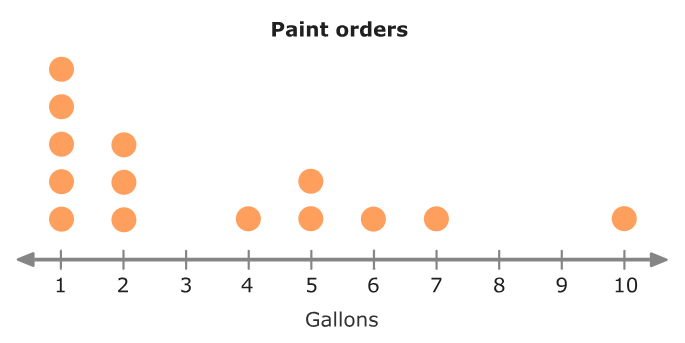
4/7
400
Find the missing piece of data.
Median: 12
Data: 19, 18, 2, 5, 8, 9, 50, x
What is 15?
400
What fraction of the people surveyed are younger than 40?
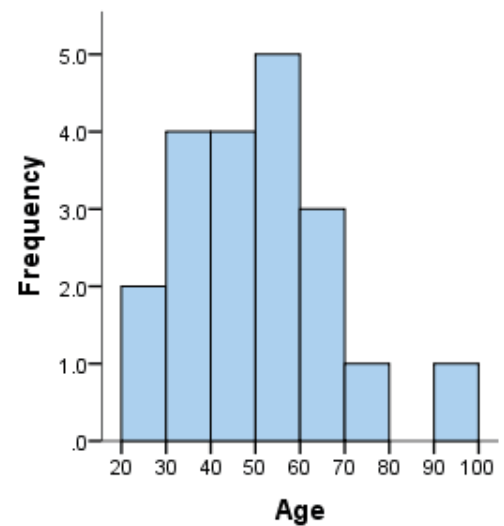
6/20 = 3/10
400
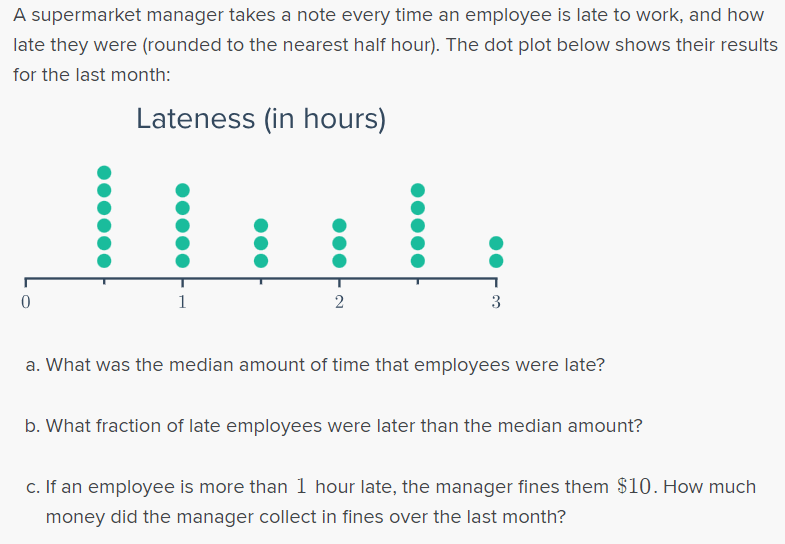
a.) median: 1.5 hours
b.) 10/24 or 5/12 of the employees
c.) $130
500
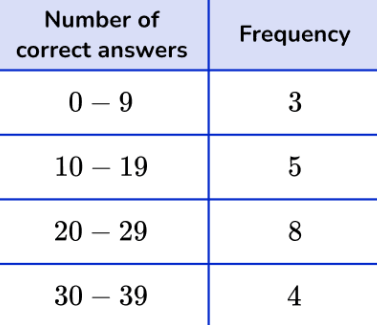
Identify the error in the frequency table below.
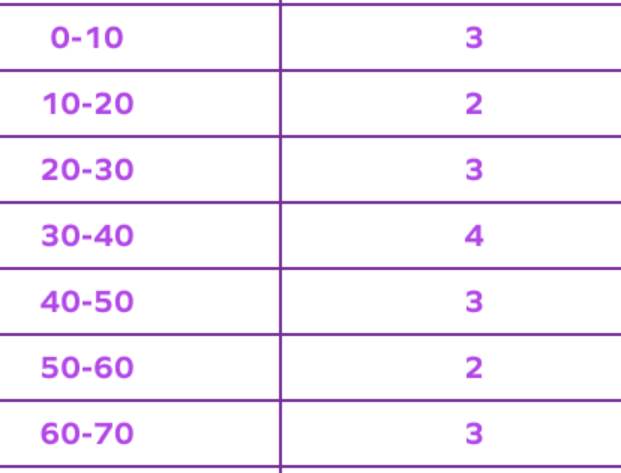
You can't have the same number in 2 intervals. It should be 0-9, 10-19, 20-29 etc.
500
If you add 15 and 17 to the data set below will your median increase, decrease or stay the same?
6, 18, 14, 12, 20, 16
It will increase (from 15 to 15.5)
500
On a state licensing test, Jean and her friends got the following scores: 76, 78, 63, 78, 97, 42, and 53. One of her friend's score was missing. They know the median of the scores is 70.5. What was the missing score?
What is 65?
500
Identify the shape(s) of the data distribution in the histograms below.
A) 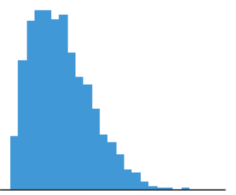
B)
C) 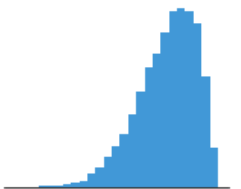
A - skewed right
B - symmetric
C- skewed left
500
Make a dot plot for the data below.
Find the median of the data.
How old are people usually when they pass the driving test? Explain.
A group of adults is asked, "How old were you when you passed your driving test?"
The responses were:
22, 17, 17, 17, 19, 21, 17, 22, 21,
18, 18, 17, 18, 22, 18
Age Passed Driving Test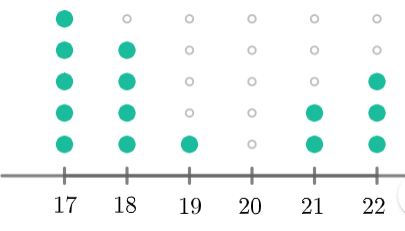
Median: 18 years
Most people are between 17 and 18 years old.