Vocabulary
Parts of a Graph
Bar and Picture Graphs
Understanding Graphs
Word Problems
100
You collect data by asking the same question over and over using a _____.
Survey
100
What part of the graph do you look at to find the topic of the graph?
Title
100
What are the two directions that a bar can show data?
Vertical and horizontal
100
Which day had the most people at the movies? 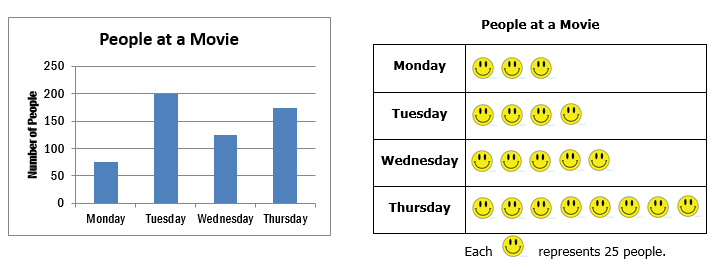
Thursday
100
Shirley read 10 pages every day for a week. How many pages did she read altogether? (Draw a table and then find the total.)
70 pages
200
What do you call the information you collect or display?
Data
200
What do you call a picture that is used to stand for something else?
A symbol
200
If you are using a survey to make a bar graph, what do the bars show?
How many people chose that answer.
200
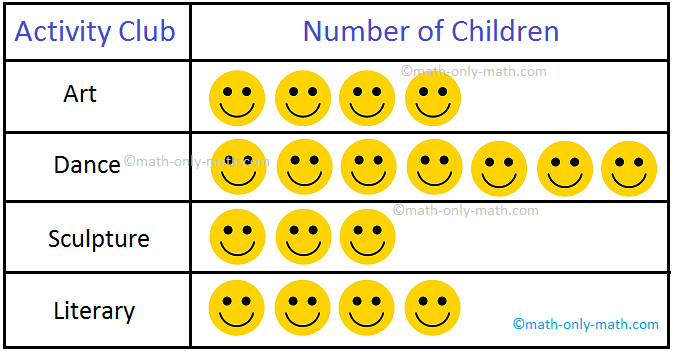 How many children liked Art and Sculpture?
7
200
Bob, Bill, and Barry went to the park. They each took 2 Frisbees with them. How many Frisbees did they have in all? (Draw a table and then find the total.)
6 Frisbees
300
This kind of graph uses bars to display the data?
Bar Graph
300
What labels would you need to add to a graph about class favorite lunch choices?
Lunch Choices
Number of Votes
300
A picture graph uses a picture of a shoe to represent 5 shoes. 3 shoes are on one line of this picture graph. How many shoes does that mean?
15 shoes
300
What flower was seen the most?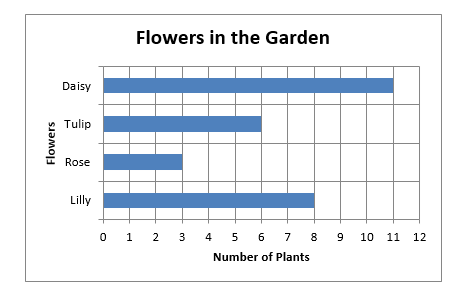
Daisy
300
Each hen in Farmer Brown's barn lays 8 eggs each week. There are 4 hens in the barn. How many eggs do they lay in all?
32 eggs
400
This kind of graph uses pictures or symbols to represent the data?
Picture Graph
400
What do you call the box at the bottom of a picture graph that tells you what the symbols mean?
The key
400
How is a bar graph different from a picture graph?
A bar graph has colored boxes instead of pictures. A bar graph has a scale and a picture graph has a key.
400
How many more Daisys are there than Lillys
3
400
There are 7 tables in the classroom. Each table has space for 3 students. How many students are in the classroom? (Draw a table and find the final answer.)
21 students
500
This kind of graph is used to show how often a certain number appears in a set of data.
Tally Graph
500
What do you call the number line on the side of a bar graph?
The scale
500
What symbol could be used on a picture graph about different kinds of food?
Possible answers: Plate, fork, different foods, etc.
500
On the graph, none of the bars are the same length. This means that the quantities of data are: the same or different?
Different
500
Each student at the table has 5 notebooks. There are 4 students at each table. How many notebooks are in each table basket? (Draw a table and find the final answer.)
20 notebooks