Vocabulary
Parts of a Graph
Bar and Picture Graphs
Money
Miscellaneous
100
Picture graphs use a _____ to tell you how much each picture is worth.
Legend/key
100
What part of the graph do you look at to find the topic of the graph?
Title
100
what is the title of this graph?
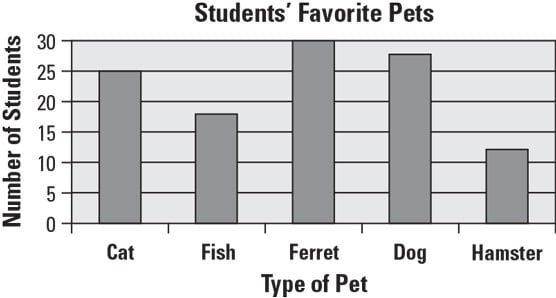
Students favorite pets
100
What is the value of six dimes?
$0.60, 60 cents
100
How many pets does Ms. Strehlow have? What is there name(s)?
1 - Remi
200
Marks made to keep track of things during a survey are called __________.
Tally marks
200
What do you call a picture that is used to stand for something else?
A symbol
200
What is the graph counting by?

2's
200
How many quarters make $1.00?
4 quarters
200
How many years has Ms. Strehlow taught?
4
300
This kind of graph uses bars to display the data?
Bar Graph
300
What are the names of categories called? Ex: chocolate chip, sprinkle, sugar
Labels
300
How many people like Snickers and Reeces?
14
300
What is the value of 3 dimes, 2 nickels, and 7 pennies?
$0.47, 47 cents
300
What did your Ms. Strehlow do last weekend?
Went to a dance competition.
400
This kind of graph uses pictures or symbols to represent the data?
Picture Graph
400
What do you call the box at the bottom of a picture graph that tells you what the symbols mean?
The key/legend
400
How many goldfish and cats does this person own?

6
400
Show a way to make $0.90 (excluding 90 pennies)
Answers will vary
400
How many siblings does Ms. Strehlow have?
1
500
A __________ is a simple graph that uses a number line and X's to show how many times something happens.
Line Plot
500
To add data to your graph, look at the ________.
table
500
How many cats and Ferrets does this person own?
55
500
Show two different ways to make $1.10 (excluding 110 pennies)
Answers will vary
500
Name one animal Ms. Strehlow saw on spring break.
starfish, dolphin, alligator, jellyfish, many dogs