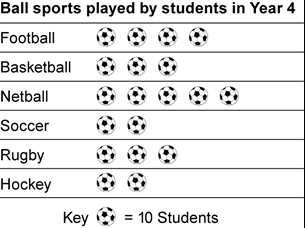
This kind of graph uses pictures or symbols to represent the data?
Pictograph
Lines used to count things instead of using numbers are called _________________.
tally marks
How many 4th graders played basketball this year?

30
The words "M&M Bar Graph" make up what part of this graph?

the title
What is the most popular sport for students to play?

Netball

Bar Graph
Information that is collected and represented on a graph is called ___________________.
data
What symbol could be used on a picture graph about different kinds of food?
Possible answers: Plate, fork, different foods, etc.
What is this part of a graph called?
Key
How many more people own goldfish than rabbits?
2
This kind of graph uses bars to display the data?
Bar Graph
The _______ is the average in a set of data.
Mean
What is the difference between the number of students who have cats for pets and the number of students who have goldfish ?
4 more students own cats than own goldfish
The ________ introduces the data in a graph and tells you what the graph is about.
Title
How many more cupcakes were sold on Thursday than Tuesday?

6

Pictograph
The ______ is the number that occurs most often in a set of data.
Mode
How many more cupcakes were sold on Friday than on Monday?

12
In this graph, the bucket of sand is a __________ to represent ________ _____________.

In this graph the bucket of sand is a symbol to represent sand castles.
How many more students played netball than rugby?

20
How is a bar graph different from a picture graph?
A bar graph has colored boxes instead of pictures. A bar graph has a scale and a picture graph has a key.
A question asked to several people to get information about one topic is a __________________.
survey
If 
Then what does 
 5 apples
What are the numbers along the side of this graph that show the intervals called?

scale
How many more people owned dogs than hamsters?
3