Using a Survey
Picture Graphs
Bar Graphs
Matching
More Mixed Bag
100
If 3 more people picked banana how many votes would there be?
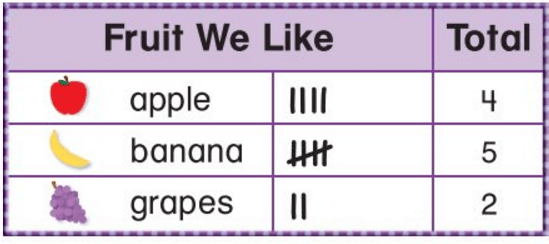
What is 8
100
How many students liked Reading?
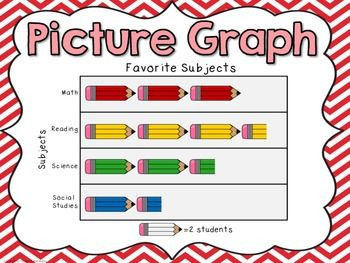
What is 7
100
How many more students liked Frozen than the Little Mermaid?
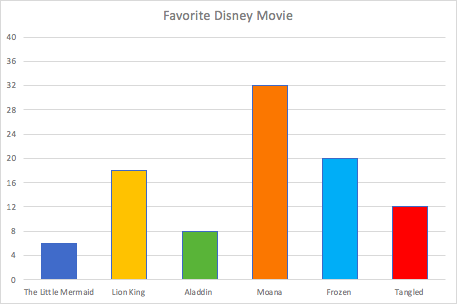
What is 14
100
The bar graph shows the number of hamburgers sold at Bob’s Burger Shack. On which days were more than 80 hamburgers sold?
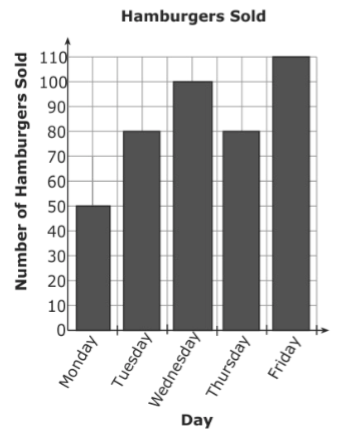
What is Wednesday and Friday
100
How many days did I go to the beach in August and July?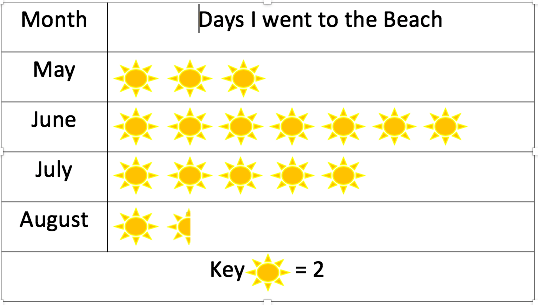
What is 13
200
How many people either walk or take the car?
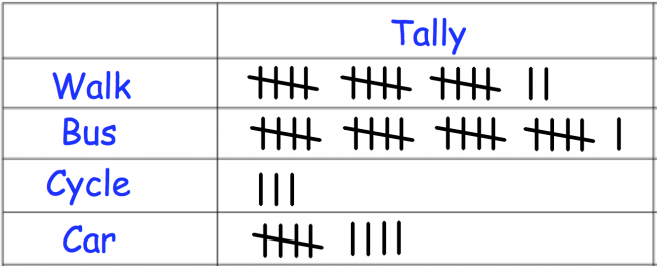
What is 26
200
How many people picked apple as their favorite fruit?

What is 10
200
Which movie was the favorite?
What is Moana
200
Which is the correct graph?

A
200
How many morechocolate cones were sold than cotton?
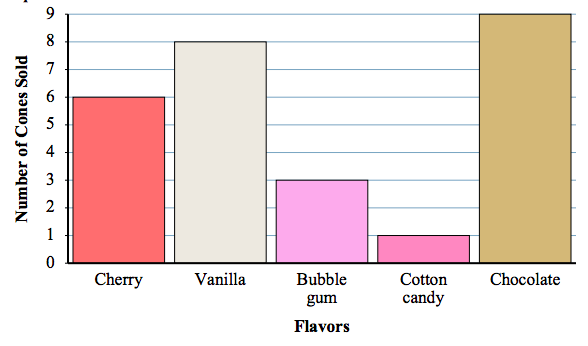
What is 8
300
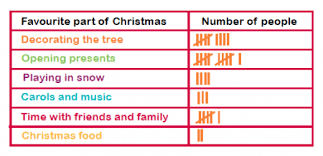
What question is the survey asking?

What is the favorite food
300
How many apples were sold in February?
(Pay attention to the key)

What is 40
300
What is 23 beads.
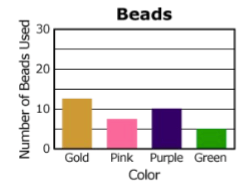
What are 23 beads
300
Which is the correct graph?
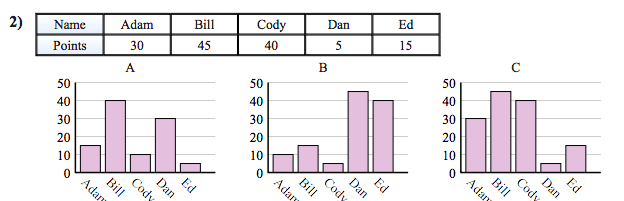
C
300
How many people liked
What is Day and Number of Turtles
400
How many people were surveyed?
What is 35
400
How many students picked purple as their favorite color?
What is 17
400
How many students had a birthday in June and September? 
What is 17
400
Which is the least favorite movie?
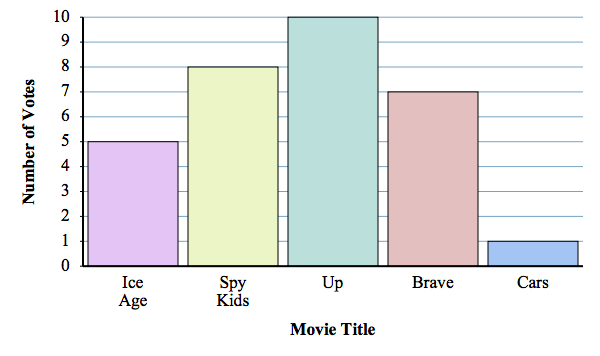
What is Cars
400
Miss Lee's science class collected data on the color of 3rd grade student's eyes. How many more students had blue eyes than brown eyes?
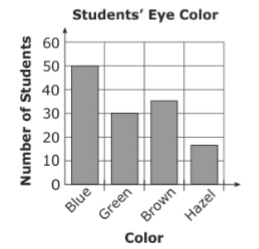
What is 15 more students
500
How many more people take the bus than the car?
What is 12
500
How many students liked hockey and football?
(Pay attention to the key)
What is 50
500
What month had the fewest birthdays?
What is August
500
What is the most number of books read by the students?
What is 1
500
How many students are in 3rd grade?

What is 80