Line Plots and Line Graphs
Multiplication
Picture and Circle Graphs
Bar Graphs
Graphing vocabulary
100
A line graph shows a change over time. Between what two days was there the largest INCREASE in donuts sold?

Thursday to Friday
100
8 x 3 = ?
24
100
Pictograph
100
What color got picked the least?

blue
100
What is usually found at the top of the graph that tells you what it is about?
a. key b. title c. x-axis
a title
200
How many more cars were sold on Friday than Thursday?
Each x = 1

4
200
9 x 5 =
45
200
How many cupcakes were sold on Tuesday?
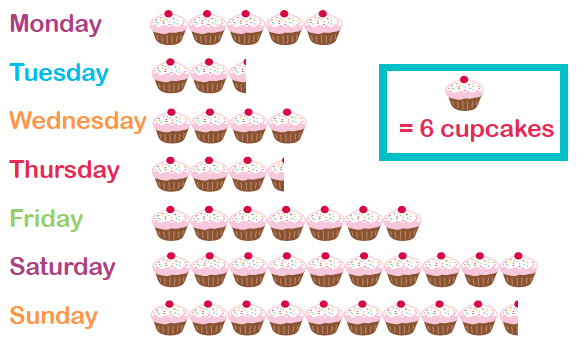
15
200

Bar Graph
200
What is this part of a graph called?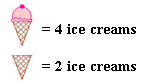
Key
300
Which month sold the MOST produce?

June
300
12 x 5 = ?
60
300
What did the family spend the MOST money on?

Airplane tickets
300
How many more students own cats than goldfish?
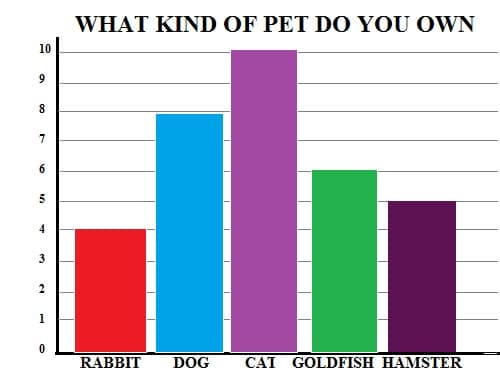
4 more students
300
A question asked to several people to get information about one topic is a __________________.
a. survey b. test c. tally mark
survey
400
What is the graph below?
Line Plot OR Bar Graph
Line plot
400
9 x 8 =
72
400
Each picture represents 2. How many sand castles did Carolyn build?
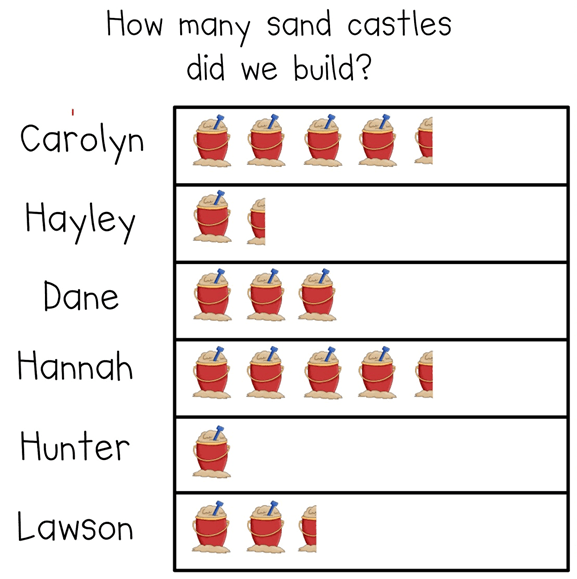
9
400
What color got picked the most?
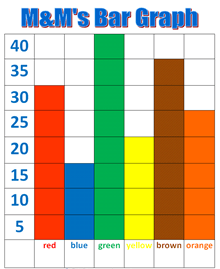
green
400
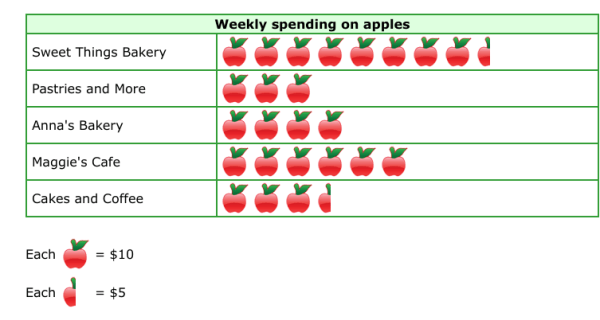
If 
Then what does half an apple equal? 
 5 apples
500
What is the graph below?
Line Graph OR Circle graph?
Line Graph
500
3 x 3 x 6 =
54
500
How many students played soccer this year?
*look at the key*
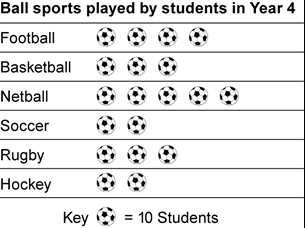
20
500
How many children picked yellow?

9
500
Small lines used to count things instead of using numbers are called _________________.
a. tally marks b. pictures c. circles
tally marks