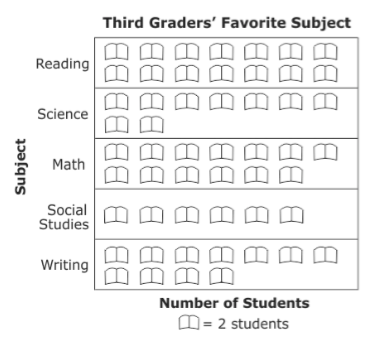
Which subject did 18 students pick as their favorite?
What is Science.
Lines used to count things instead of using numbers are called _________________.
tally marks
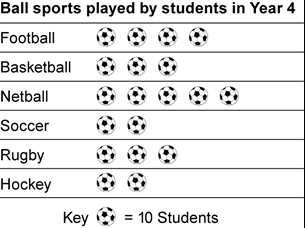
How many more 4th graders played Netball than Soocer?

What is 30
How many more students picked Reading than Soc. Studies?
What is 16.
How many students had a birthday in April, May and June?

What is 21
Information that is collected and represented on a graph is called ___________________.
data
How many more ate green M & M's than blue?
What is 25.
What is this part of a graph called?
Key
How many pieces of candy did Chloe and Paige get?
What is 40.
According to the Frequency Chart which pet was the favorite?

What is the dog and cat.
How many pieces of candy did Rachel collect?
What is 32.
How many students come by bus and daycare?
What is 60.
What does each X in this line plot represent?

Each X represents a book checked out of the library.
How many students picked purple and green as their favorite color?
What is 28.
Which bakery spent the least amount of money on apples?

What is Pastries and More
____________ means to explain the information you see on a graph.
interpret
How many more cupcakes were sold on Sunday than on Thursday?

What is 36
Who spent $35 on apples?
What is Cakes and Coffee.
Which type of transportation did 25 students use to get to school?
What is the car pool.
How many people picked pepperoni or cheese pizza?
What is 55.
A question asked to several people to get information about one topic is a __________________.
survey
If 
Then what does 
 5 apples
What information is begin shown in the below graph?

The number of M & M's eaten.


