Identifying Graphs
Reading Graphs 1
Reading Graphs 2
Parts of a Graph
Multiplication & Division
100
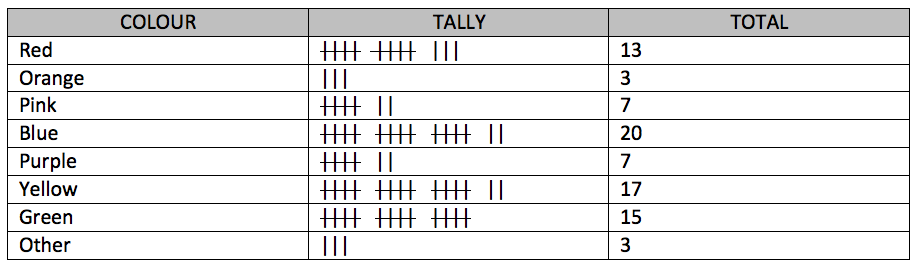
Frequency Table
100
How many student birthdays are in September?

7
100
How many 4th graders played basketball this year?
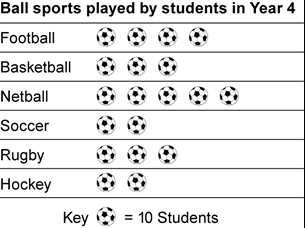
30
100
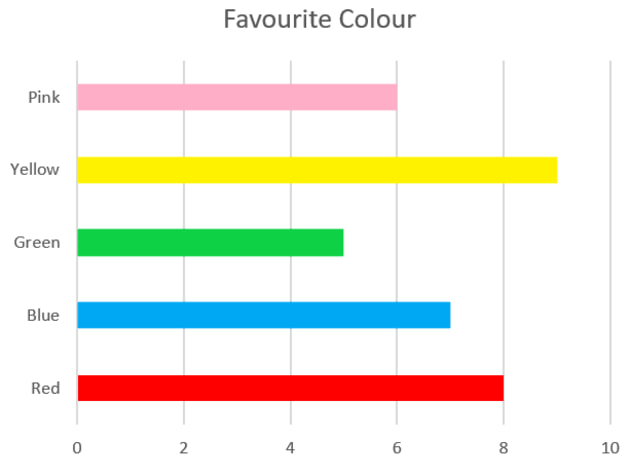
The words "M&M Bar Graph" make up what part of this graph?
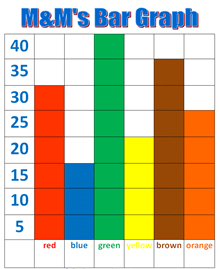
the title
100
3 X 9 = _______
27
200

Bar Graph
200
How many cars were sold over the weekend (Saturday and Sunday)?

8 cars
200
How many hours did most of the class spend reading this week?

two and 1/2 hours
200
What is this part of a graph called?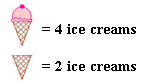
Key
200
8
300

Pictograph
300
The average temperature in Spring is about what?
about 56 degrees
300
What is the difference between the number of students who have cats for pets and the number of students who have goldfish ?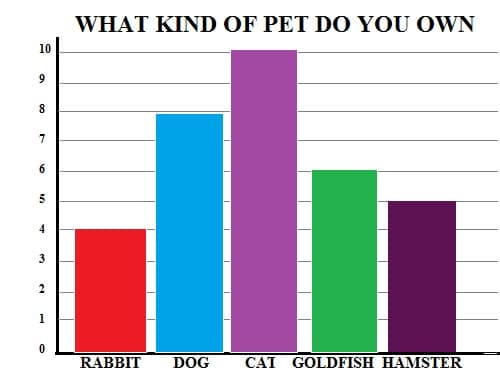
4 more students own cats than own goldfish
300
What does each X in this line plot represent?
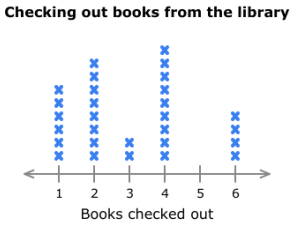
Each X represents a book checked out of the library.
300
11 x 11 =
121
400
Bar graph
400
How many more people read 1 book last summer than read 2 books last summer?

3 more people
400
How many more cupcakes were sold on Friday than on Monday?
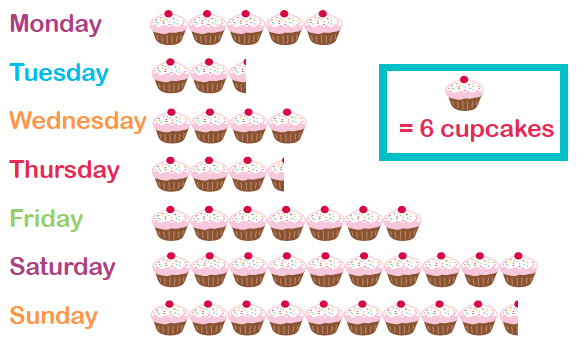
12
400
In this pictograph, the bucket of sand is a __________ to represent ________ _____________.
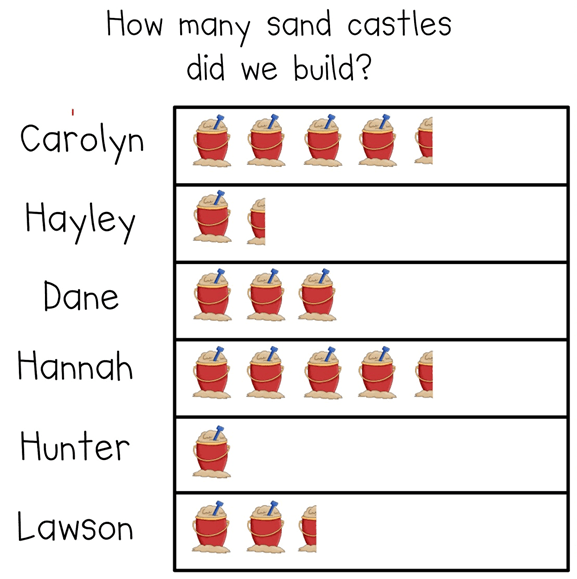
In this graph the bucket of sand is a symbol to represent sand castles.
400
How many times does 8 go into 96?
12
500
Dot Plot
500
How many children think Margherita is their favorite pizza flavor?

11 children
500
If 
Then what does 
 5 apples
500
What are the numbers along the side of this graph that show the intervals called?

scale
500
120 x 4 =
480