Line Graphs
Line/Dot Plots
Pie Charts
Bar Graphs
Pictograms
100
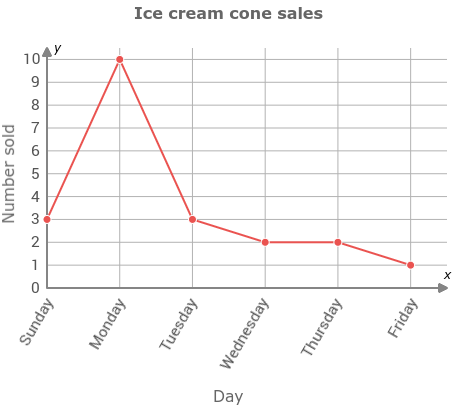
On which day were 10 ice cream cones sold?
Monday
100
A football fan counted how many touchdowns some players made. How many players scored exactly 3 touchdowns last season?
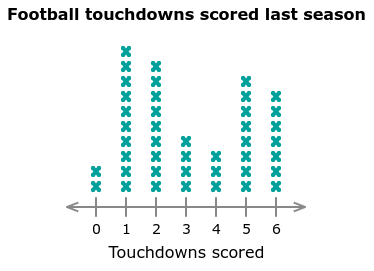
4 players
100
Which is the most favorite among the customers?
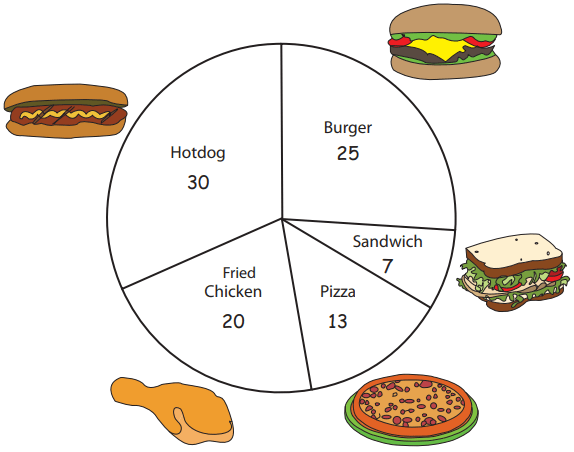
Hotdog
100
Each student in Mr. Hawke’s class gave one vote for his or her favorite type of zoo animal. The graph shows the results. What is the total number of students in Mr. Hawke’s class?
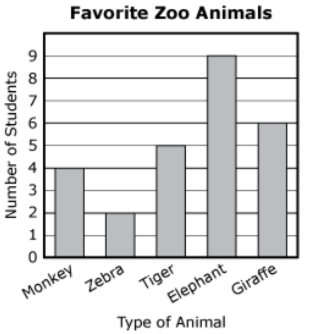
26 students
100
How many books does each symbol represent?
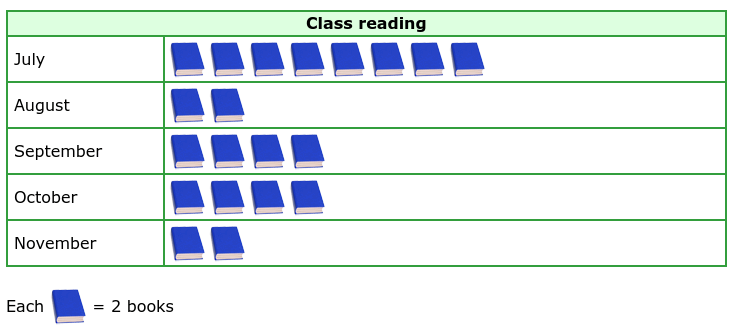
2 books
200
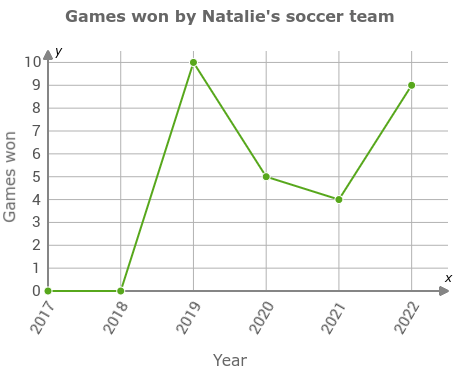
How many games did the soccer team win in 2022?
9 games
200
Some friends participated in a pull-up contest. How many participants did at least 4 pull-ups?
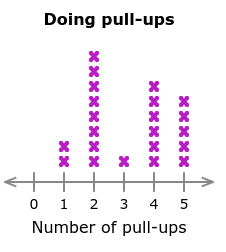
11 participants
200
Which two activities are equally popular?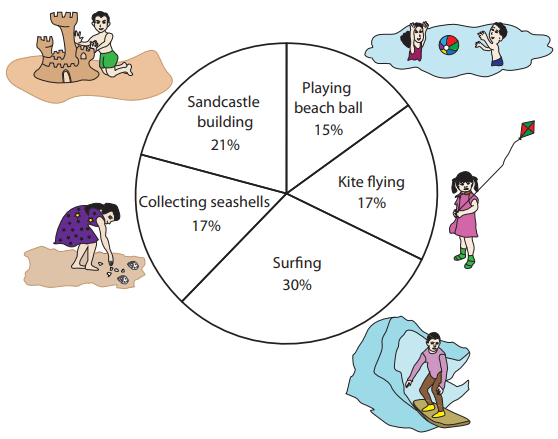
Collecting seashells and Kite flying
200
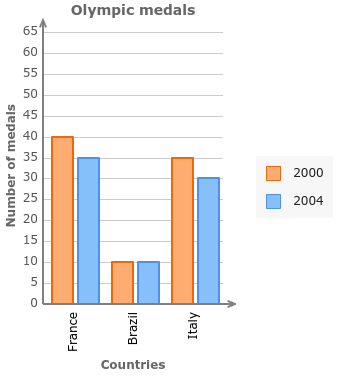
In 2004, how many more medals did France win than Brazil?
25
200
How much did Main Street Bakery have in pumpkin pie sales?
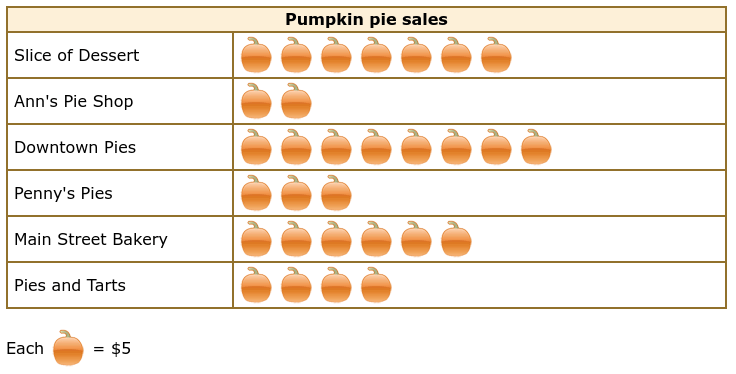
$30
300
How old was Caitlin when she was 30 inches tall?
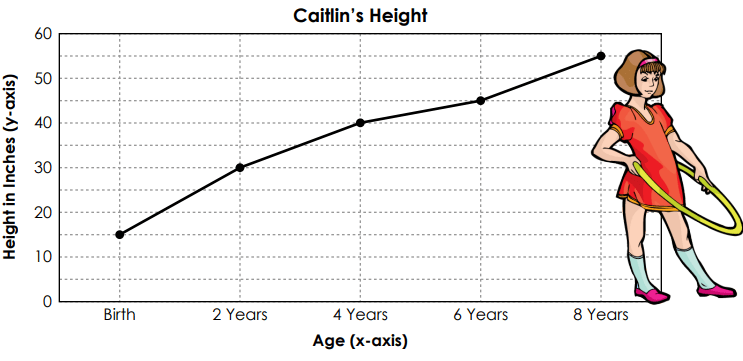
2 years old
300
How many students received a score in the 90s?
17 students
300
Edna earned a good income during her summer vacation. The pie graph displays the money she earned by doing different jobs. How much she would have earned if she did not take the job as a Papergirl?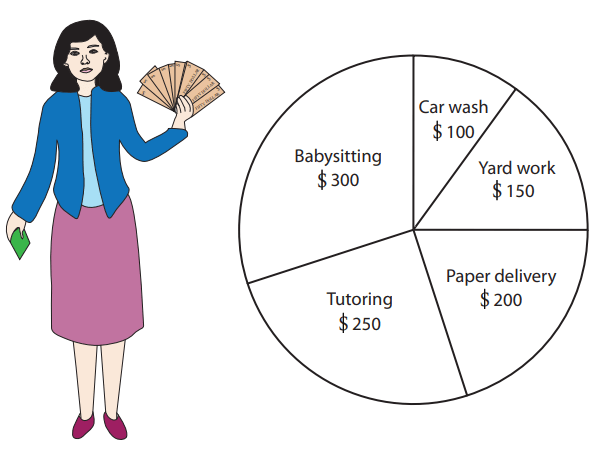
$800
300
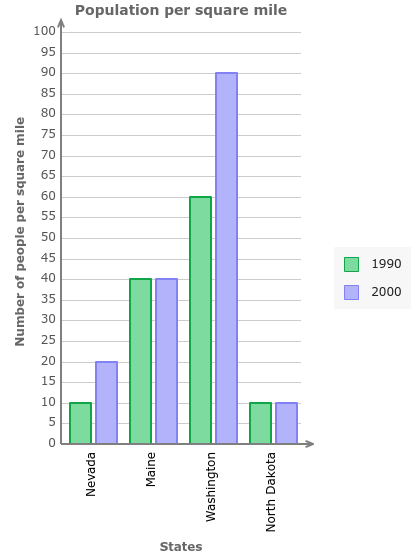
In 1990, how many more people per square mile lived in Washington than in Maine?
20 people per square mile
300

$20
400
On which day did Gotham City have the highest temperature?
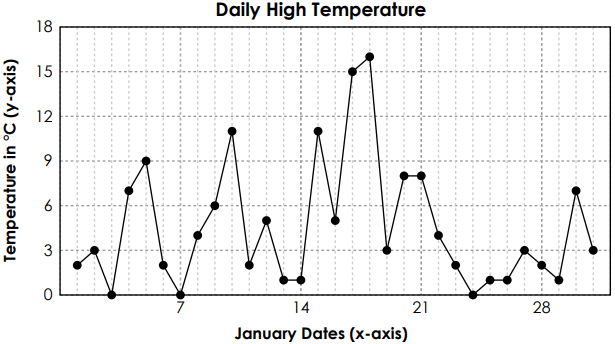
January 18
400
A teacher counted the number of times that students went down the slide during recess. How many students went down the slide more than 1 time?

30 students
400
What percentage of students like an activity other than sandcastle building?
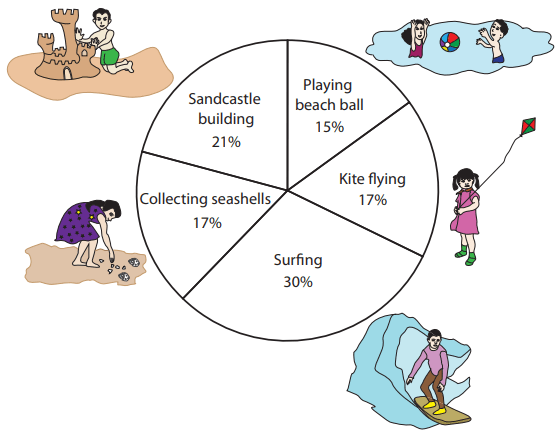
79%
400
The first 10 presidents of the United States were born in four states. The bar graph shows the number of presidents born in each state.
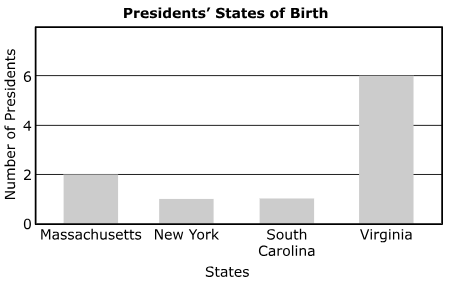 How many more presidents were born in Virginia than in New York?
5
400

12 books
500
How much had Caitlin grown from the time she was born to 6 years old?

30 inches
500
Elijah ate trail mix nine different times. Each X on the line plot represents an amount that he ate. How much total trail mix, in cups, did Elijah eat?
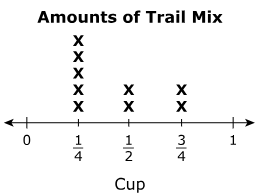
15/4
500
The pie graph shows the information on the number of farm animals owned by some farm owners. What is the total percent of animals owned by Jason and Walter?
50%
500
How many more packages did Mr. Conley deliver on Monday and Tuesday than he did on Thursday and Friday?
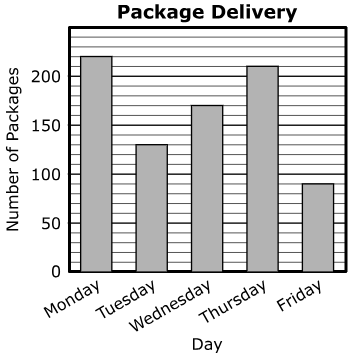
50 packages
(350 on Mon&Tues - 300 on Thurs&Fri = 50)
500
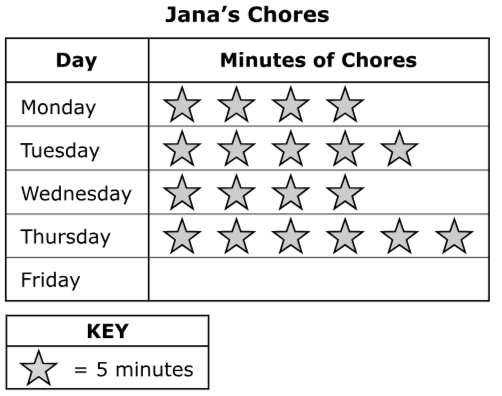
Jana spends a total of 130 minutes doing chores during the week. How many stickers should Jana get on Friday?
7 stickers