Line Graphs
Coordinate Grids
Numerical Patterns
Graphing Numerical Patterns
Mixed Review
100
What is being measured on the X-axis?
The week number.
100
What color point is at the origin?

Red
100
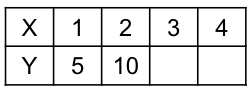
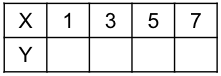
What is the missing number?
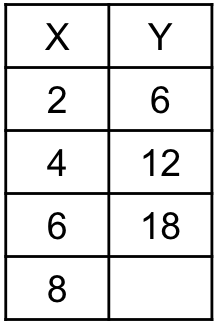
24
100
Graph this table on a coordinate grid.
100
What are the four wettest months?
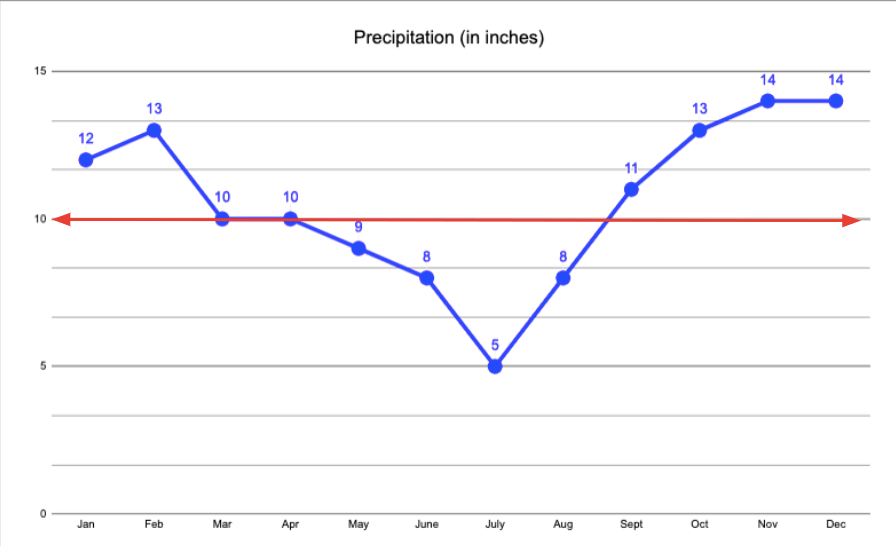
February, October, November & December
200
What is being measured on the Y-axis?
Each puppies weight.
200
What color point is at 7,5?

Purple
200
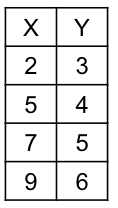
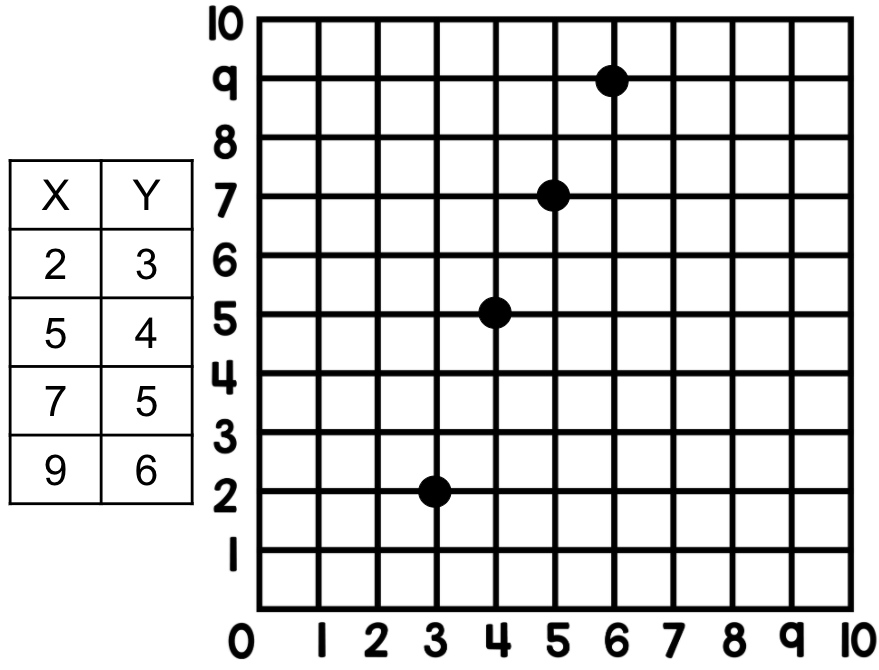
What is the rule for finding Y from X?
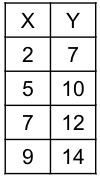
Add 5
200
Finish the table and graph it on a coordinate grid.
200
If the red line represents the average precipitation, which months have below average precipitation?

May, June, July & August
300
Which puppy weighed approximately 5 ounces at birth?
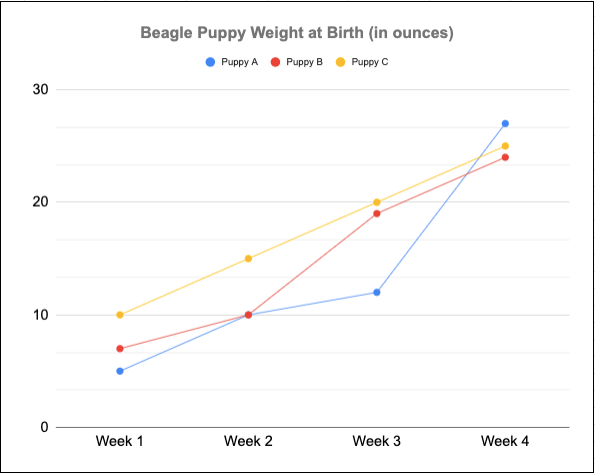
Puppy A
300
Which point lies directly on the x axis? (excluding the origin)
The yellow point
300
If the rule is X + 3, finish the Y pattern.
4, 6, 8, 10
300
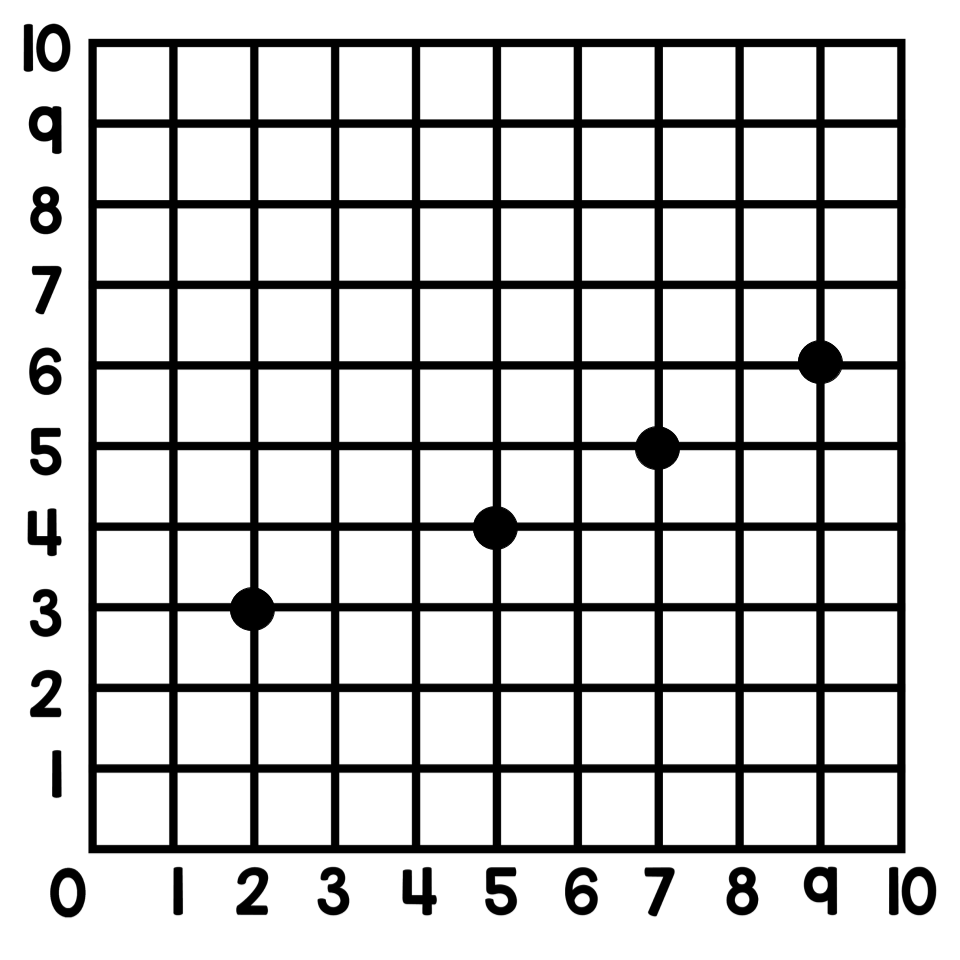
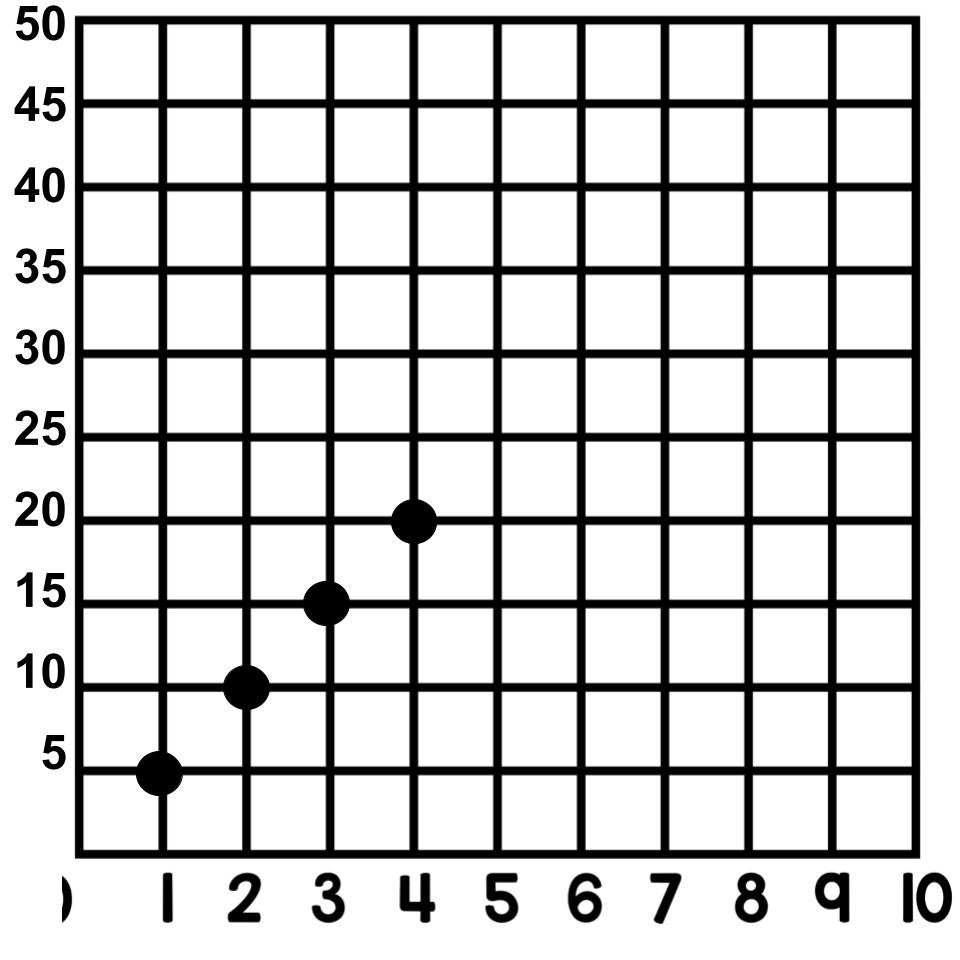
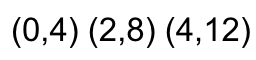
Explain the mistake the student made when they graphed the table.
The student graphed the y pattern on the x axis and the x pattern on the y axis.
300
A teacher asks her students to graph the heights of the students in the classroom. What type of data is this? Categorical, Numerical or Changes Over Time?
Numerical
400
Which puppy will most likely reach 30 ounces by week 5?

Puppy A
400
Which point lies directly on the y axis? (excluding the origin)

The orange point
400
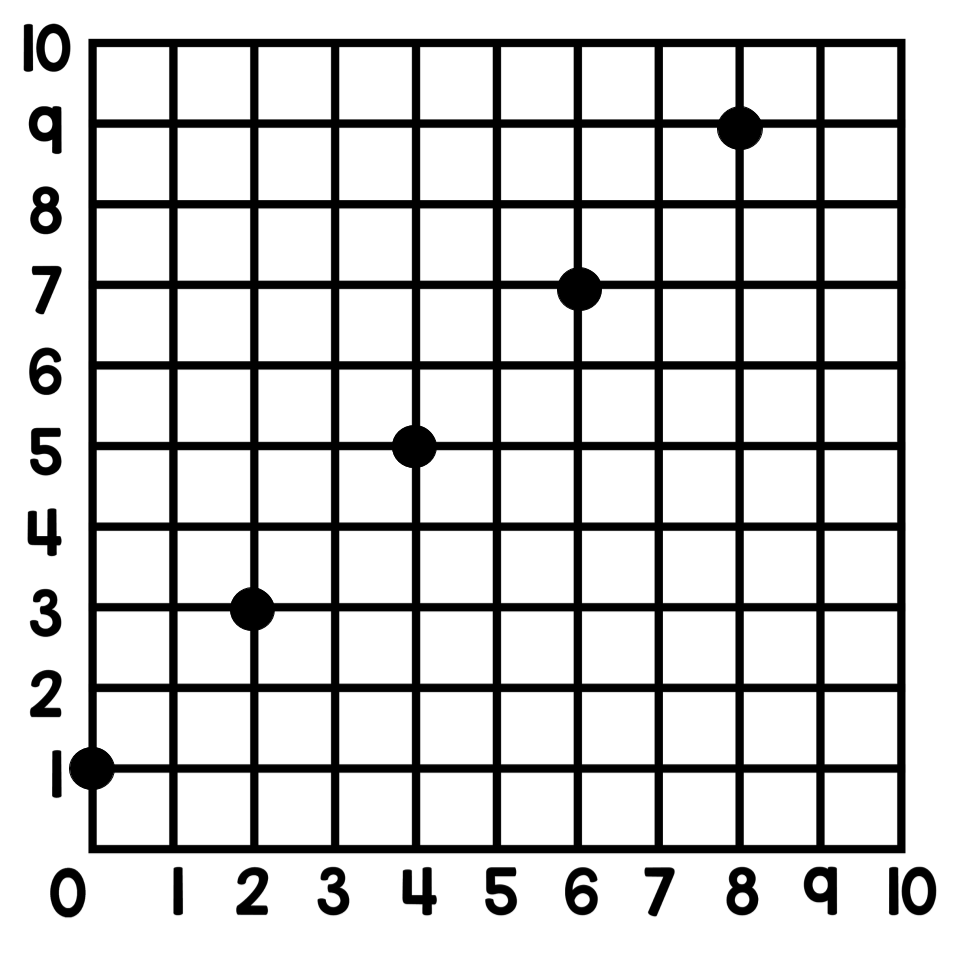
What would the next coordinate pair be?
(6,16)
400
Write down the 3 coordinate points on the graph and predict the next coordinate point in the pattern.
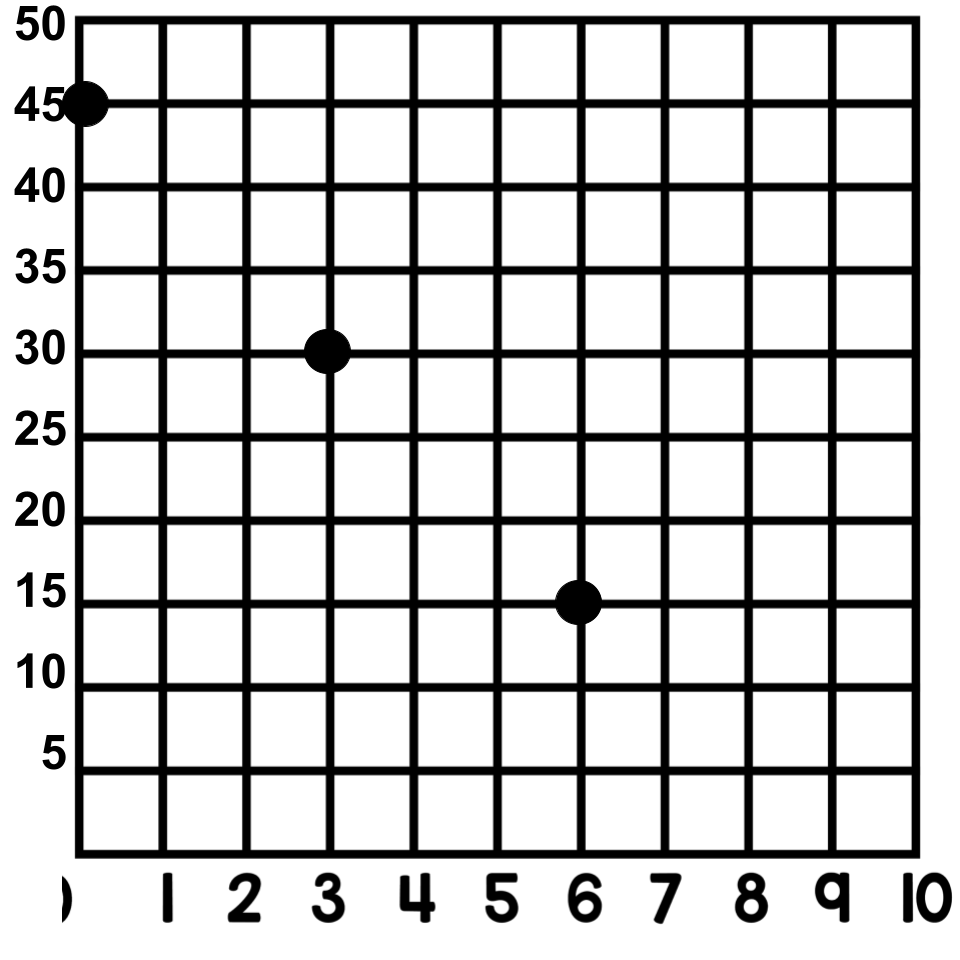
(0,45) (3,30) (6,15) (9,0)
400
If the point moves down 1 space and to the left 2 spaces what is the location of the new coordinate point?
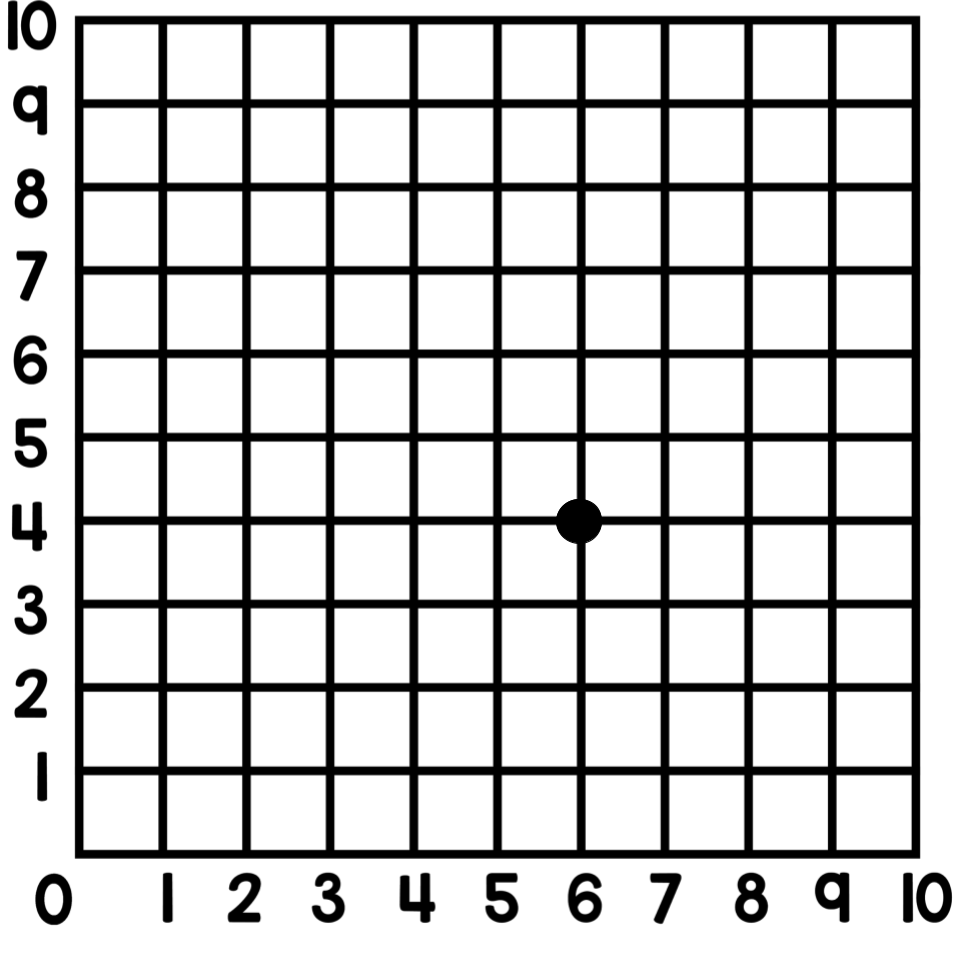
(4,3)
500
Which type of data does this graph show?

Changes over time
500
What point could be added to create a rectangle?
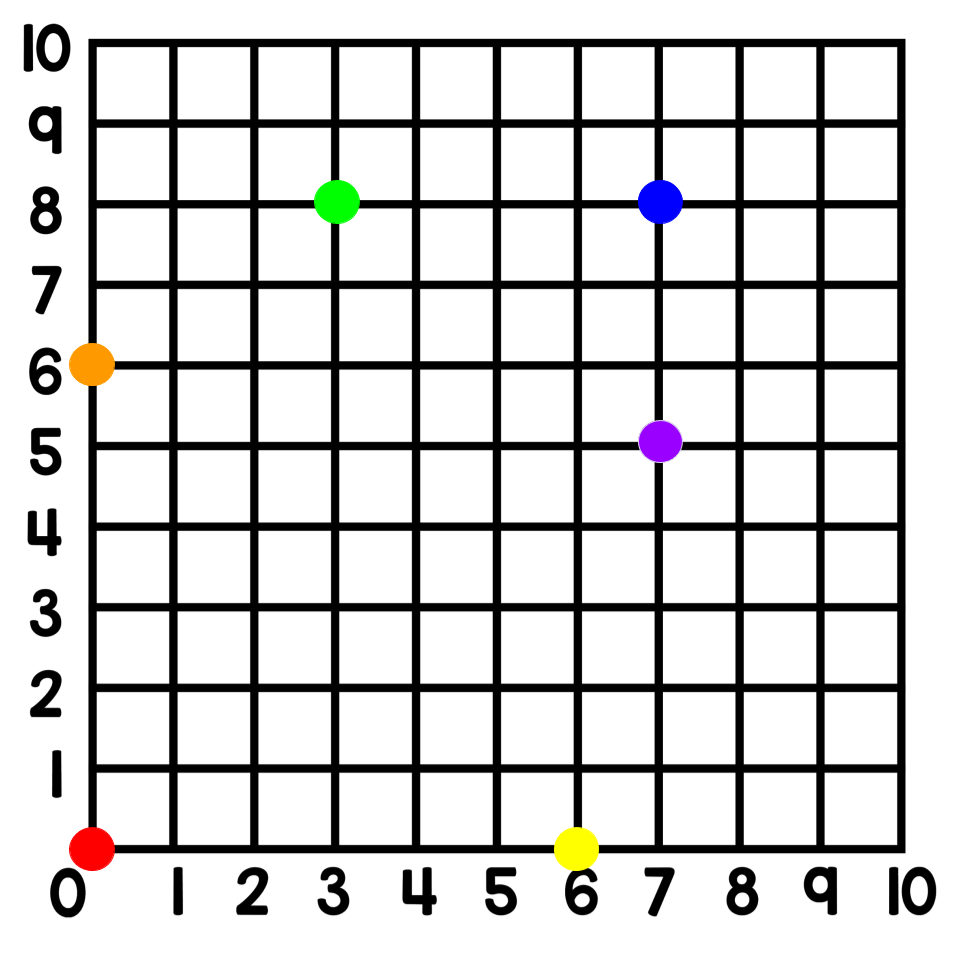
(3,5) or (6,6)
500
What are the first 3 coordinate pairs with the given patterns below?
Pattern X: Start with 1, add 4
Pattern Y: Start with 2, add 5
(1,2) (5,7) (9,12)
500
Graph the first 5 points of these rules on a coordinate grid.
Pattern X: Start with 0, add 2
Pattern Y: Start with 0, add 3
500
The graph shows total number of necklaces made. If the pattern continues how many necklaces will be made on day 13?

7 necklaces