Diagrams
Written Response
Planting a Native Lawn
Magnets & Gravity
Magnets & Gravity
pt. 2
pt. 2
Water Cycle Diagram
100
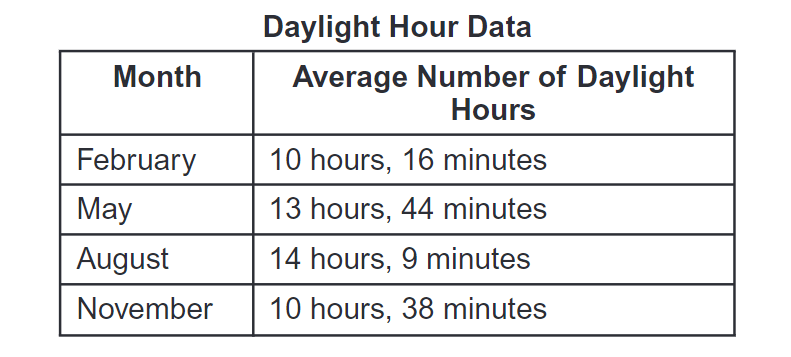
A student in Missouri records the average number of daylight hours during 4 months of the year. The results are shown in the data table below. Which conclusion is BEST supported by the data provided?
A. The sun is larger & brighter in May & August than it is in February & November
B. Earth rotates slower on its axis in May & August than it does in February & November
C. Earth is closer to the sun's orbit around the plants in May & August than it is in February & November
D. The Northern Hemisphere receives more direct daylight in May & August than it does in February & November.
D. The Northern Hemisphere receives more direct daylight in May & August than it does in February & November.
100

Describe how the turtles will be positively affected by the new zoo enclosure.
-zoo enclosure provides a land habitat for turtles
- turtles will have insects as a food source in the zoo enclosure
100
*See information on paper*
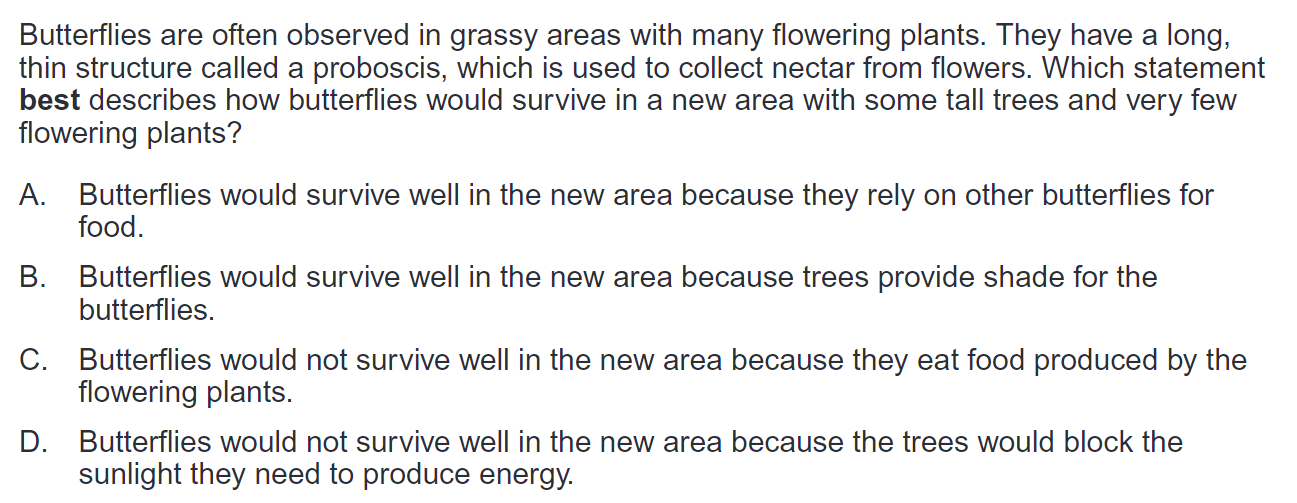
C. Butterflies would not survive well in the new area because they eat food produced by the flowering plants.
100
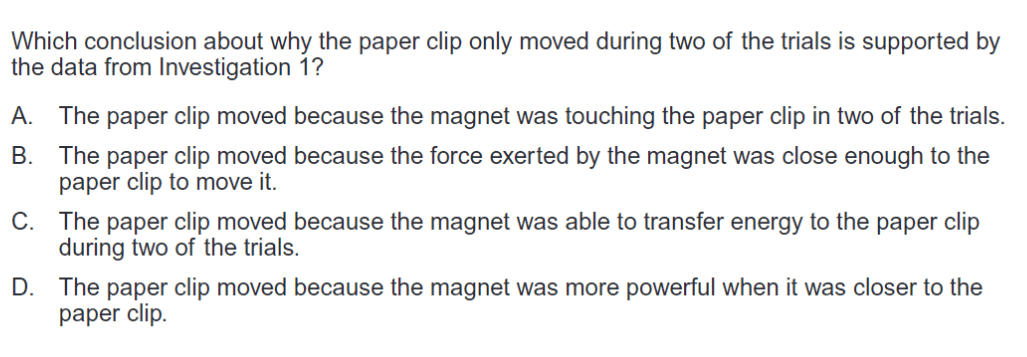
B. The paper clip moved because the force exerted by the magnet was close enough to the paper clip to move it.
100
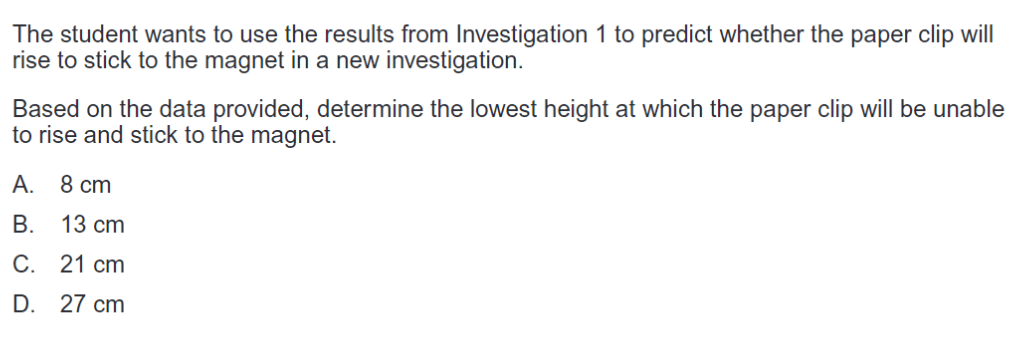
B. 13 cm
100
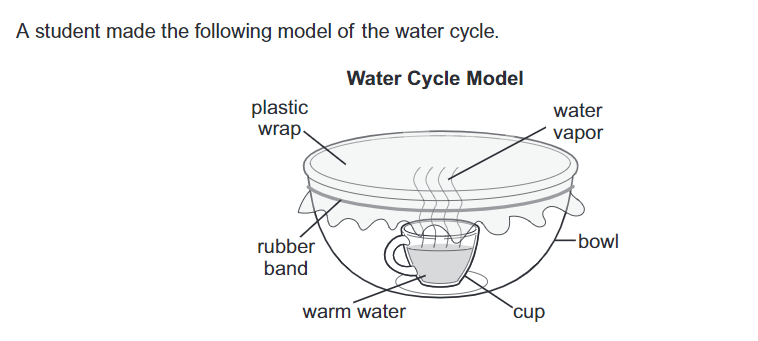 What will collect on the underside of the plastic wrap from the water vapor?
- Condensation
- Water
200
A student takes a picture of the shadow of a house at 4 different times during one day. The pictures are shown below, but they aren't in order according to the time they were taken. Identify the correct order of the pictures according to the time of day when each picture was taken.
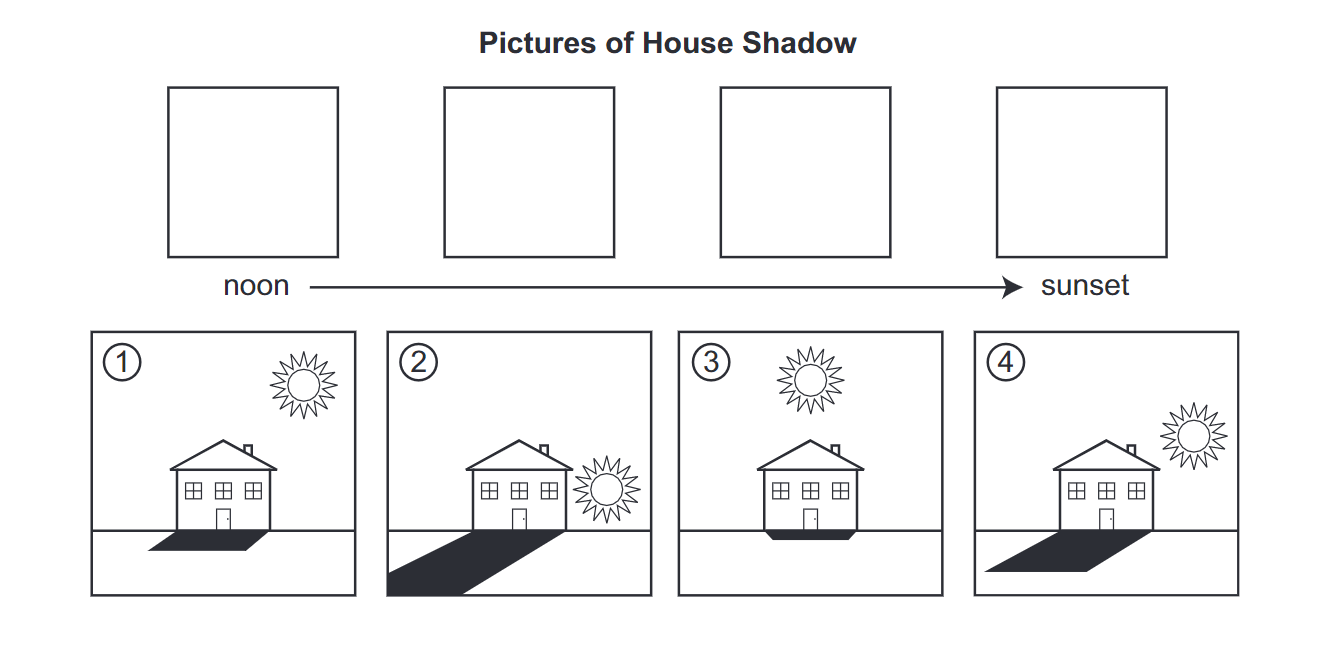
3, 1, 4, 2
200
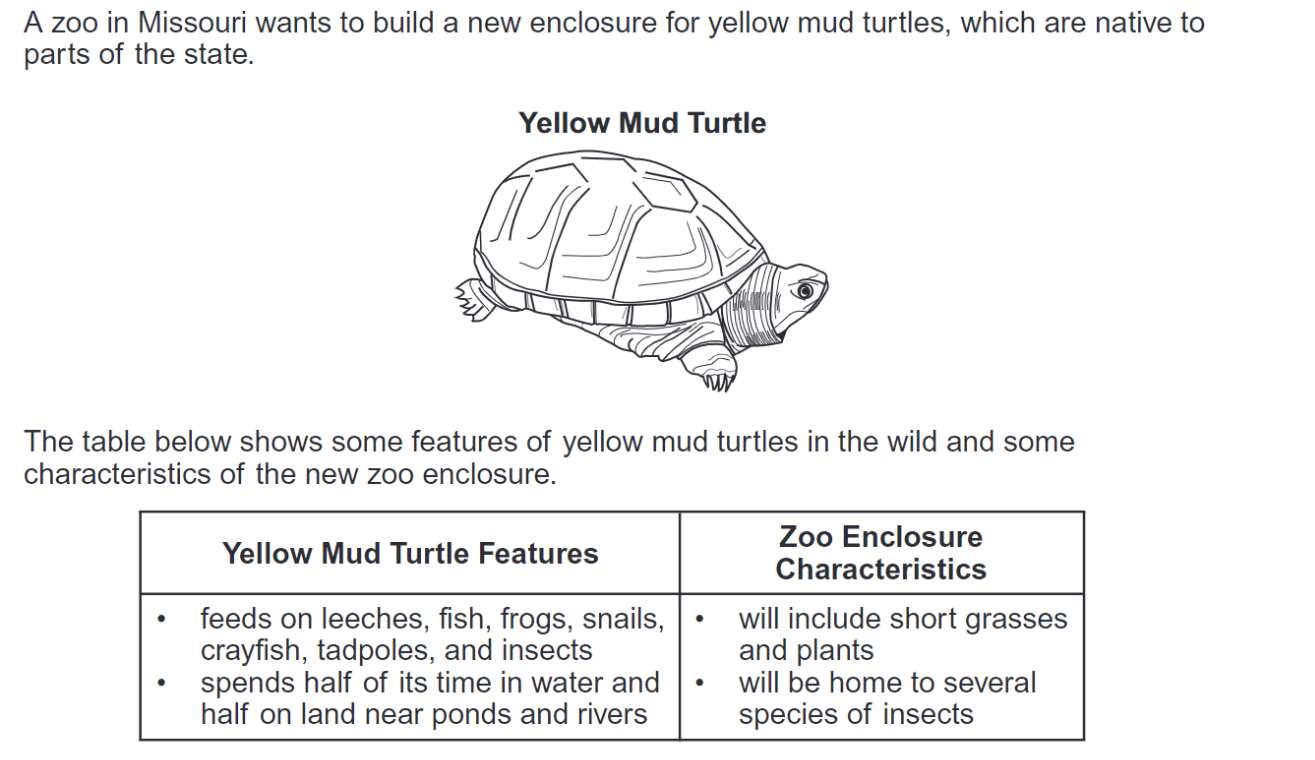
Describe how the turtles will be negatively affected by the new zoo enclosure.
- Zoo enclosure doesn't have water for the turtle's habitat
- Turtles will only have insects to eat
- Turtles will not have many food sources
200
*see information on paper*
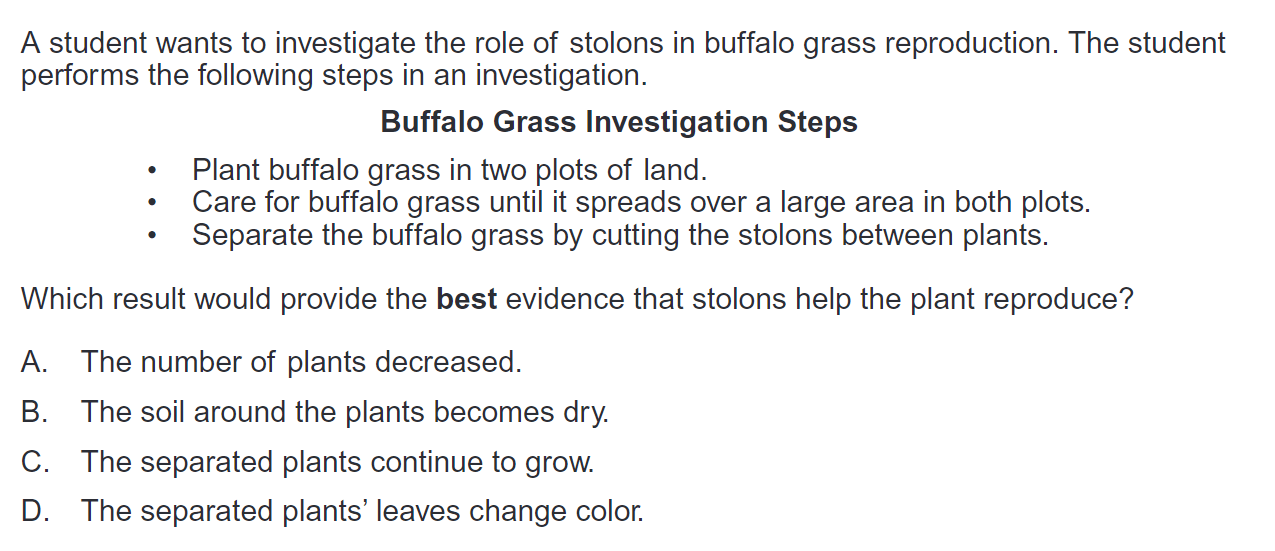
C. The separated plants continue to grow.
200
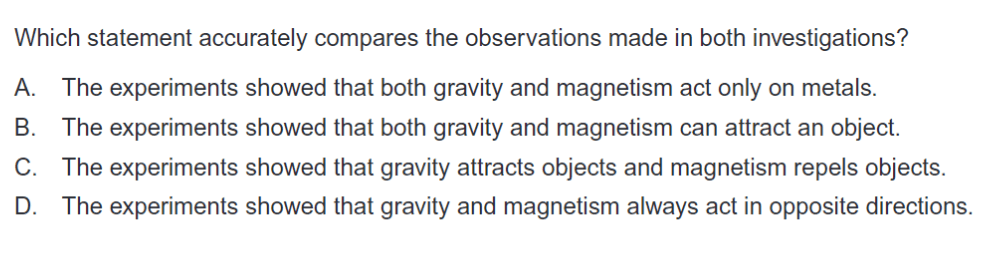
B. The experiments showed that both gravity and magnetism can attract an object
200
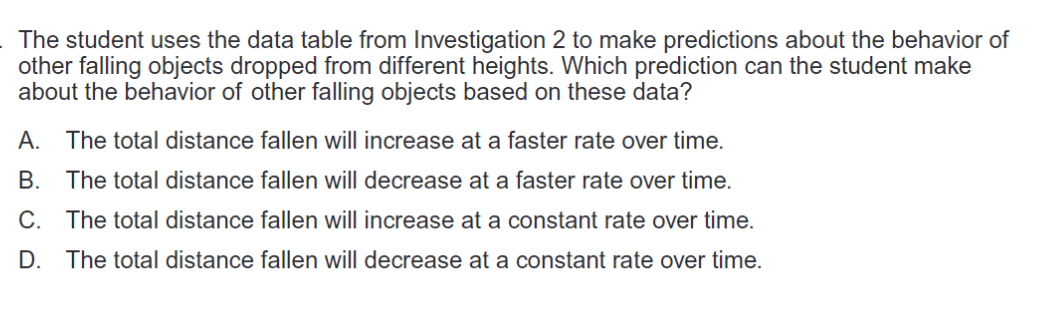
A. the total distance fallen will increase at a faster rate over time.
200

Imagine a bag of ice is added on top of the plastic wrap. Identify the TWO Earth systems that are represented by the cup of water and the bag of ice in the model.
Bag of Ice: atmosphere
Cup of water: hydrosphere
300
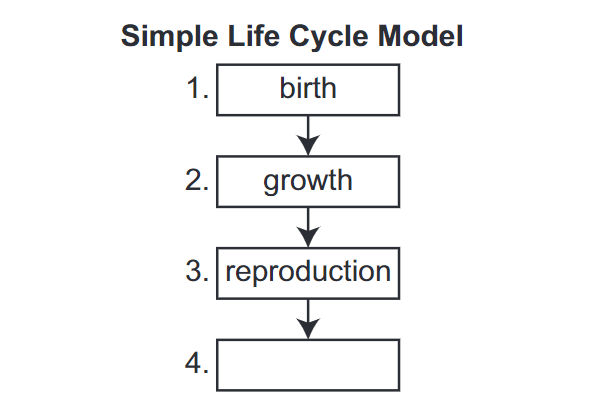
Which changes should the student make to the model to best represent the life cycle of buffalo grass?
A. Add the label “death” in step 4 & add a step for “pollination” between steps 2 and 3.
B. Add the label “survival” in step 4 & add a step for “pollination” after step 4.
C. Remove step 2 & add the label “growth” in the new step 3.
D. Move step 2 before step 1 & add the label "death" in step 4.
A. Add the label “death” in step 4 & add a step for “pollination” between steps 2 and 3.
300
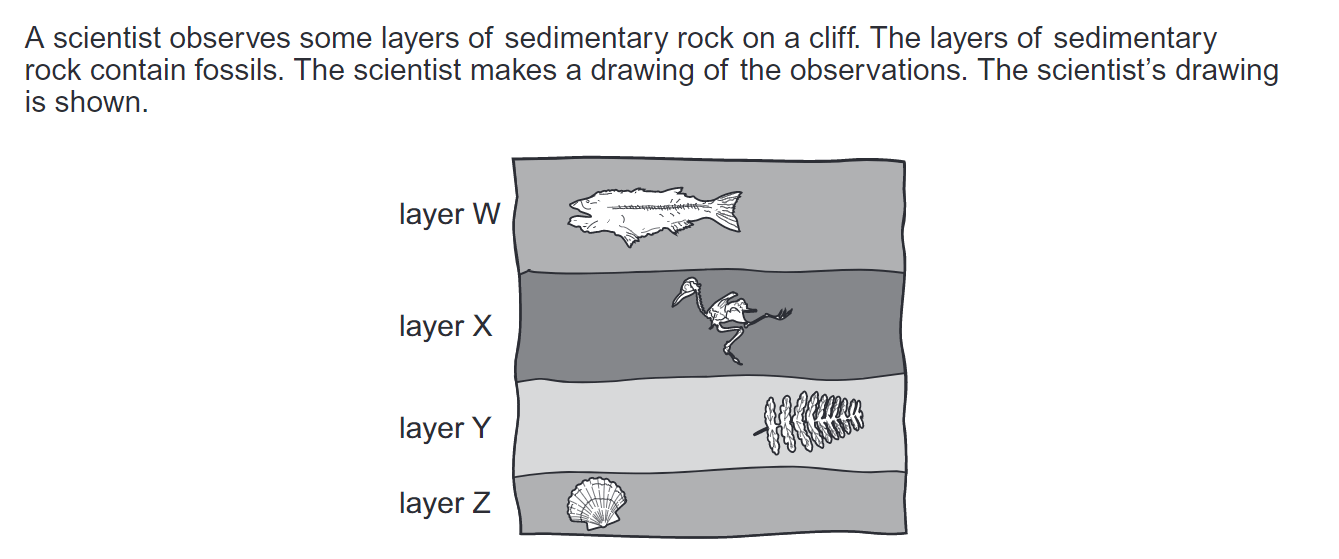
Identify the oldest layer of rock on the cliff and use evidence from the drawing to explain your answer.
- oldest rock layer z
- Any response indicating the deepest rock layer formed before the layers on top of it (law of superposition: within a sequence of layers of sedimentary rock, the oldest layer is at the base and that the layers are progressively younger with ascending order in the sequence)
300
*See information on paper*
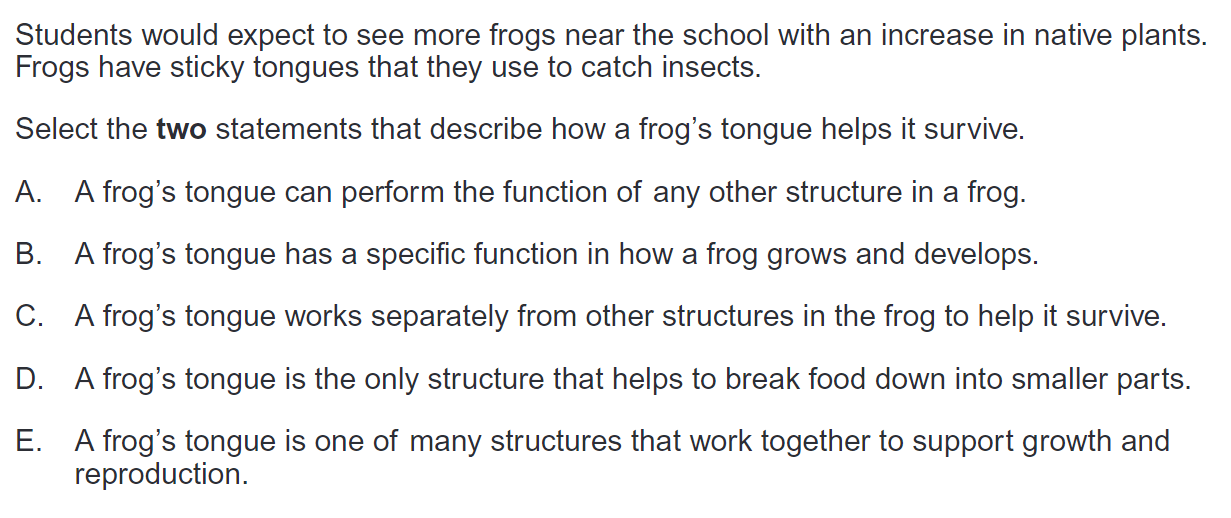
B. A frog’s tongue has a specific function in how a frog grows and develops.
E. A frog’s tongue is one of many structures that work together to support growth and reproduction.
300
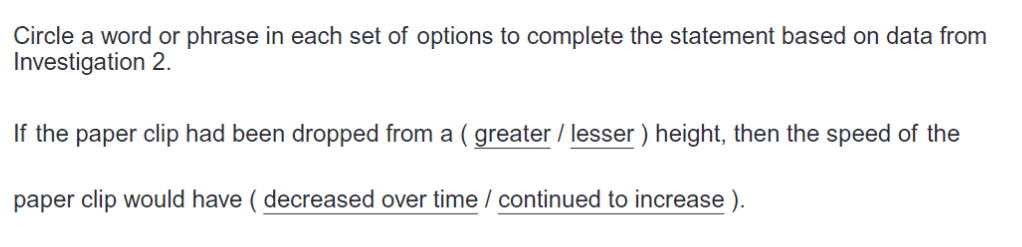
Greater; continued to increase
300
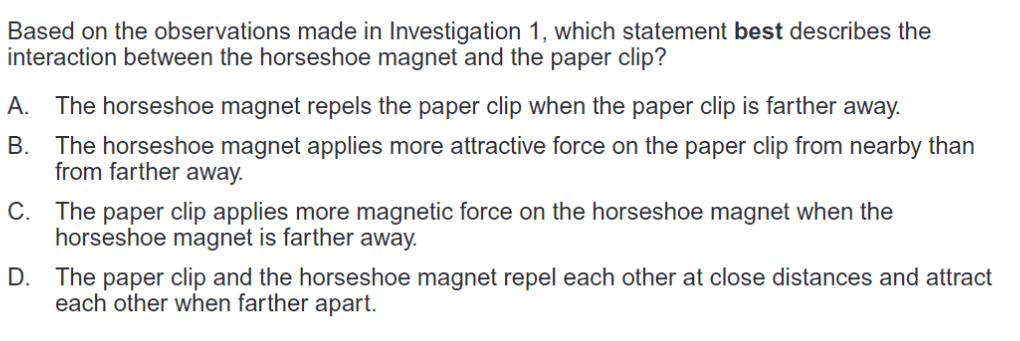
B. The horseshoe magnet applies more attractive force on the paper clip from nearby than from farther away.
300

Imagine the student adds a bag of ice on top of the plastic wrap. Describe how this change will affect the water vapor rising from the cup.
-The water vapor will cool
-The water vapor will condense, or condense more quickly.
-The water vapor will turn into precipitation (fall as rain).
400
Students are investigating the different types of freshwater on Earth. The students study the diagram below.
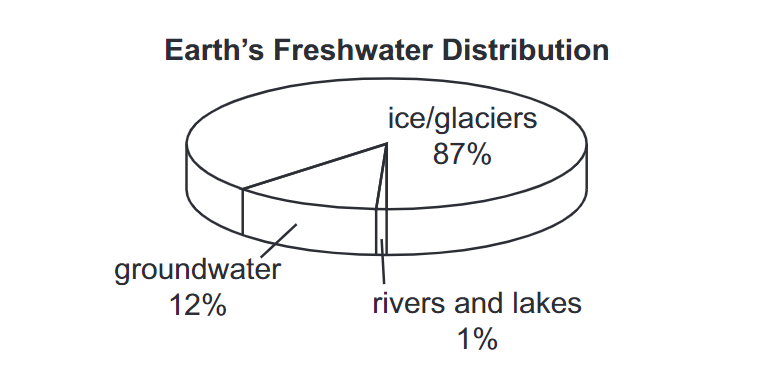
Using data from the diagram, make a bar graph that shows the percentages of the types of freshwater on Earth.
Teacher vote
400

Explain how the environment in the area observed by the scientist changed overtime. Be sure to include two different examples, with evidence, from the drawing
- A marine environment changed to a terrestrial environment from layer Z to layer Y because shells are shown in layer Z and plant leaves are shown in layer Y
-A terrestrial environment changed to a marine environment from layer X to layer W because a bird is shown in layer X and a fish is shown in layer W.
-The environment became drier from layer Z to layer Y because the fossils change from aquatic to terrestrial species.
-The environment became wetter from layer Z to layer Y because the fossils change from terrestrial to aquatic species.
400
*see information on paper*
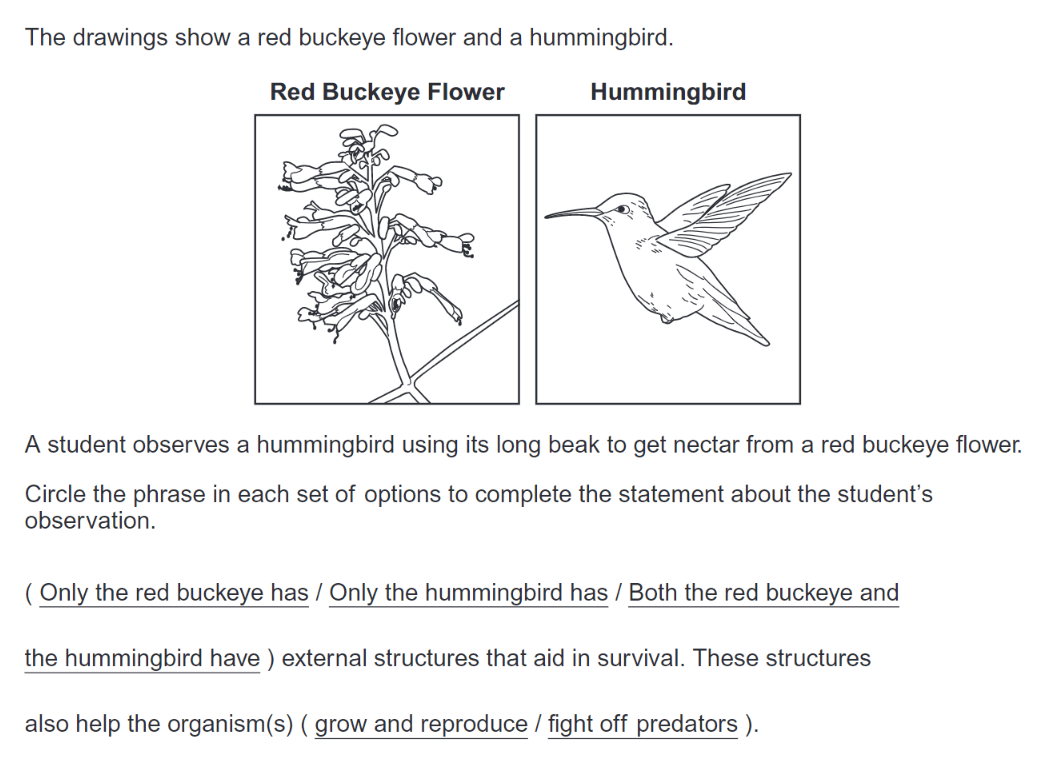
Both the red buckeye and the hummingbird have; grow and reproduce
400
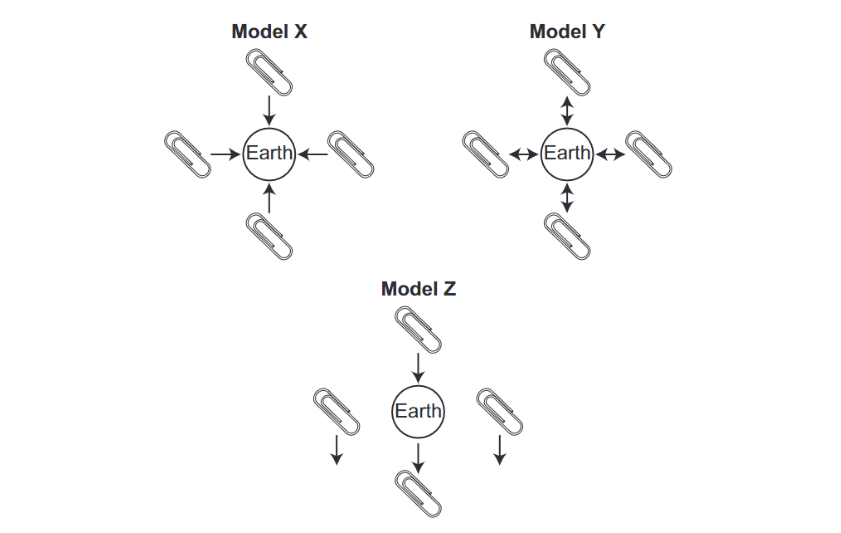
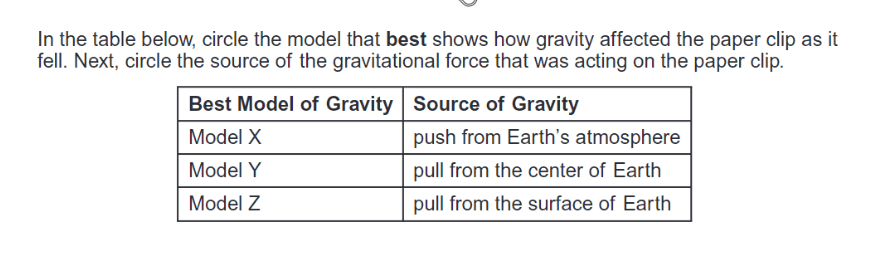
Model X; pull from the center of Earth
400
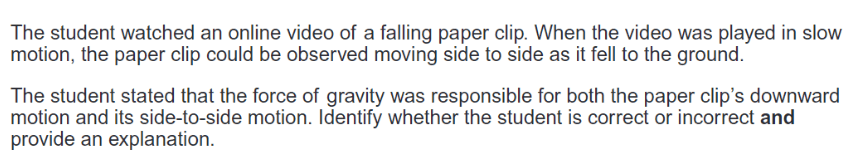
Incorrect
Gravitational pull was responsible only for the downward motion of the paperclip.
Another force, such as air resistance or wind, caused the horizontal motion of the paperclip.
400

Describe how the model can be changed to increase the rate of water moving through the water cycle.
- increase the temperature of water in the cup
- decrease the temperature near the top (plastic wrap) of the model
- any other response indicating a faster rate of water movement through the model