What is ∣9∣?
What is the definition of absolute value?
9. Absolute value is the distance from zero.
What is the difference between a bar graph and a histogram?
A histogram has a range of values per vertical bar. A bar graph is better for categorical data.
What is the variable in the following equation?
5x2 + 3x - 3 = 54
What are the coefficients?
x is the variable. 5 and 3 are coefficients.
The circle below represents one whole.
What percent is represented by the shaded area?
25%
What is ∣−0.4∣?
0.4
What is the name of this plane?
For 500 extra points: What is the name of the point (0,0)?
Coordinate plane. Origin.
What is the variable in the following equation?
8m - 38 = 56
What is the coefficient?
m, 8.
The large rectangle below represents one whole.
What percent is represented by the shaded area?
30%
What is the absolute value of 72?
72
What type of plot is represented?

Box plot (box and whiskers)
Define variable and coefficient.
Give an example of each.
A variable is a letter that represents an unknown value. A coefficient is multiplied by the variable and is always in front of the variable. If x has no written coefficient, it is understood to be 1.
Each square below represents one whole.

What percent is represented by the shaded area?
150%
What is the absolute value of -36?
36
What type of plot is represented?
Dot plot
Evaluate if x = 5.
3x - 8 = ?
3(5) - 8 = 7
Each large rectangle below represents one whole.
What percent is represented by the shaded area?
180%
What is the absolute value of 5?
What is the absolute value of -5?
For 300 extra points: What is the definition of absolute value?
5, 5. Absolute value is the distance from zero. It is always a positive value.
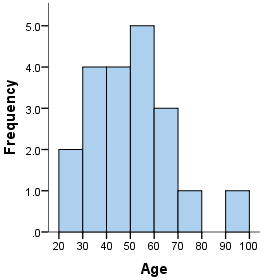
What type of graph is represented?

Histogram
Evaluate if m = 2.5
2m + 3 = ?
2(2.5) + 3 = 8
Each large square below represents one whole.

What percent is represented by the shaded area?
152%


